Verify Telemetry
This page provides comprehensive verification steps for the entire Omnia telemetry pipeline. Use the section relevant to your deployed telemetry sources.
Note
For the list of iDRAC telemetry metrics collected by Kafka and VictoriaMetrics, see iDRAC Telemetry Reference Tools.
Prerequisites
- The Set Up Telemetry procedure is complete.
- The service Kubernetes cluster is running with telemetry pods deployed.
Verify Telemetry Component Status
Verify Telemetry Pods Are Running
To verify that the iDRAC Telemetry, Kafka, LDMS, VictoriaMetrics, and VictoriaLogs pods are running:
-
Run the following command:
Run on K8s control planekubectl get pods -n telemetry -
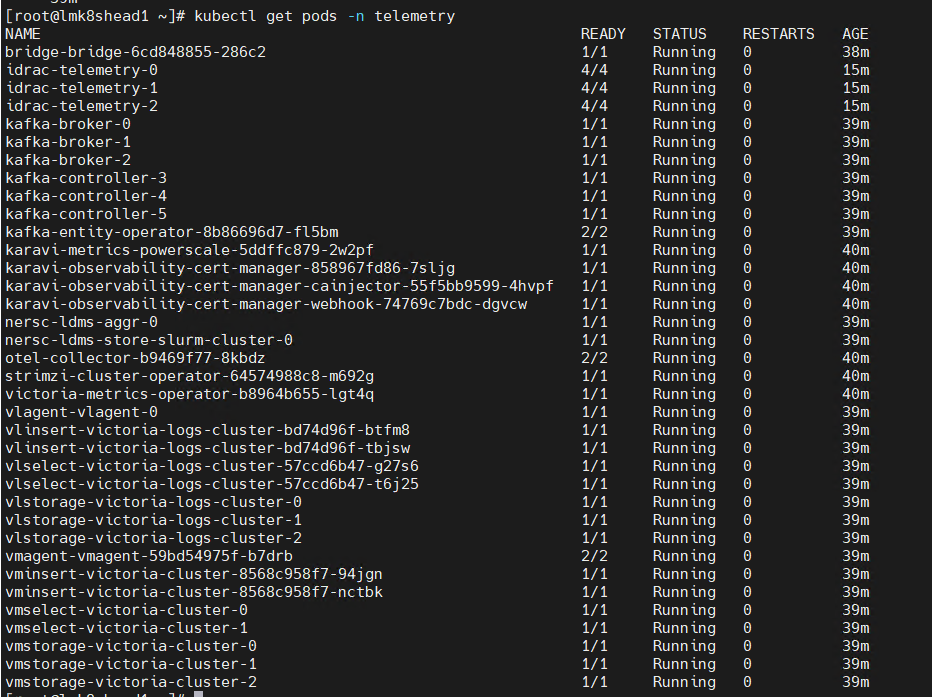
Ensure that the following pods are in a running state in the output:
- iDRAC Telemetry pods
- Kafka broker, controller, and operator pods
- LDMS aggregator and store pods
- VictoriaMetrics and vmagent pods
- vmagent-vector pod
- Vector-LDMS pod
- Vector-OME pod
- vlagent-vector pod
- VictoriaLogs pods
- PowerScale Telemetry pods
The following is the sample output:
Verify Kubernetes Telemetry Services
To verify Kubernetes telemetry services attached to the telemetry namespace:
-
Run the following command:
Run on K8s control planekubectl get svc -n telemetry -
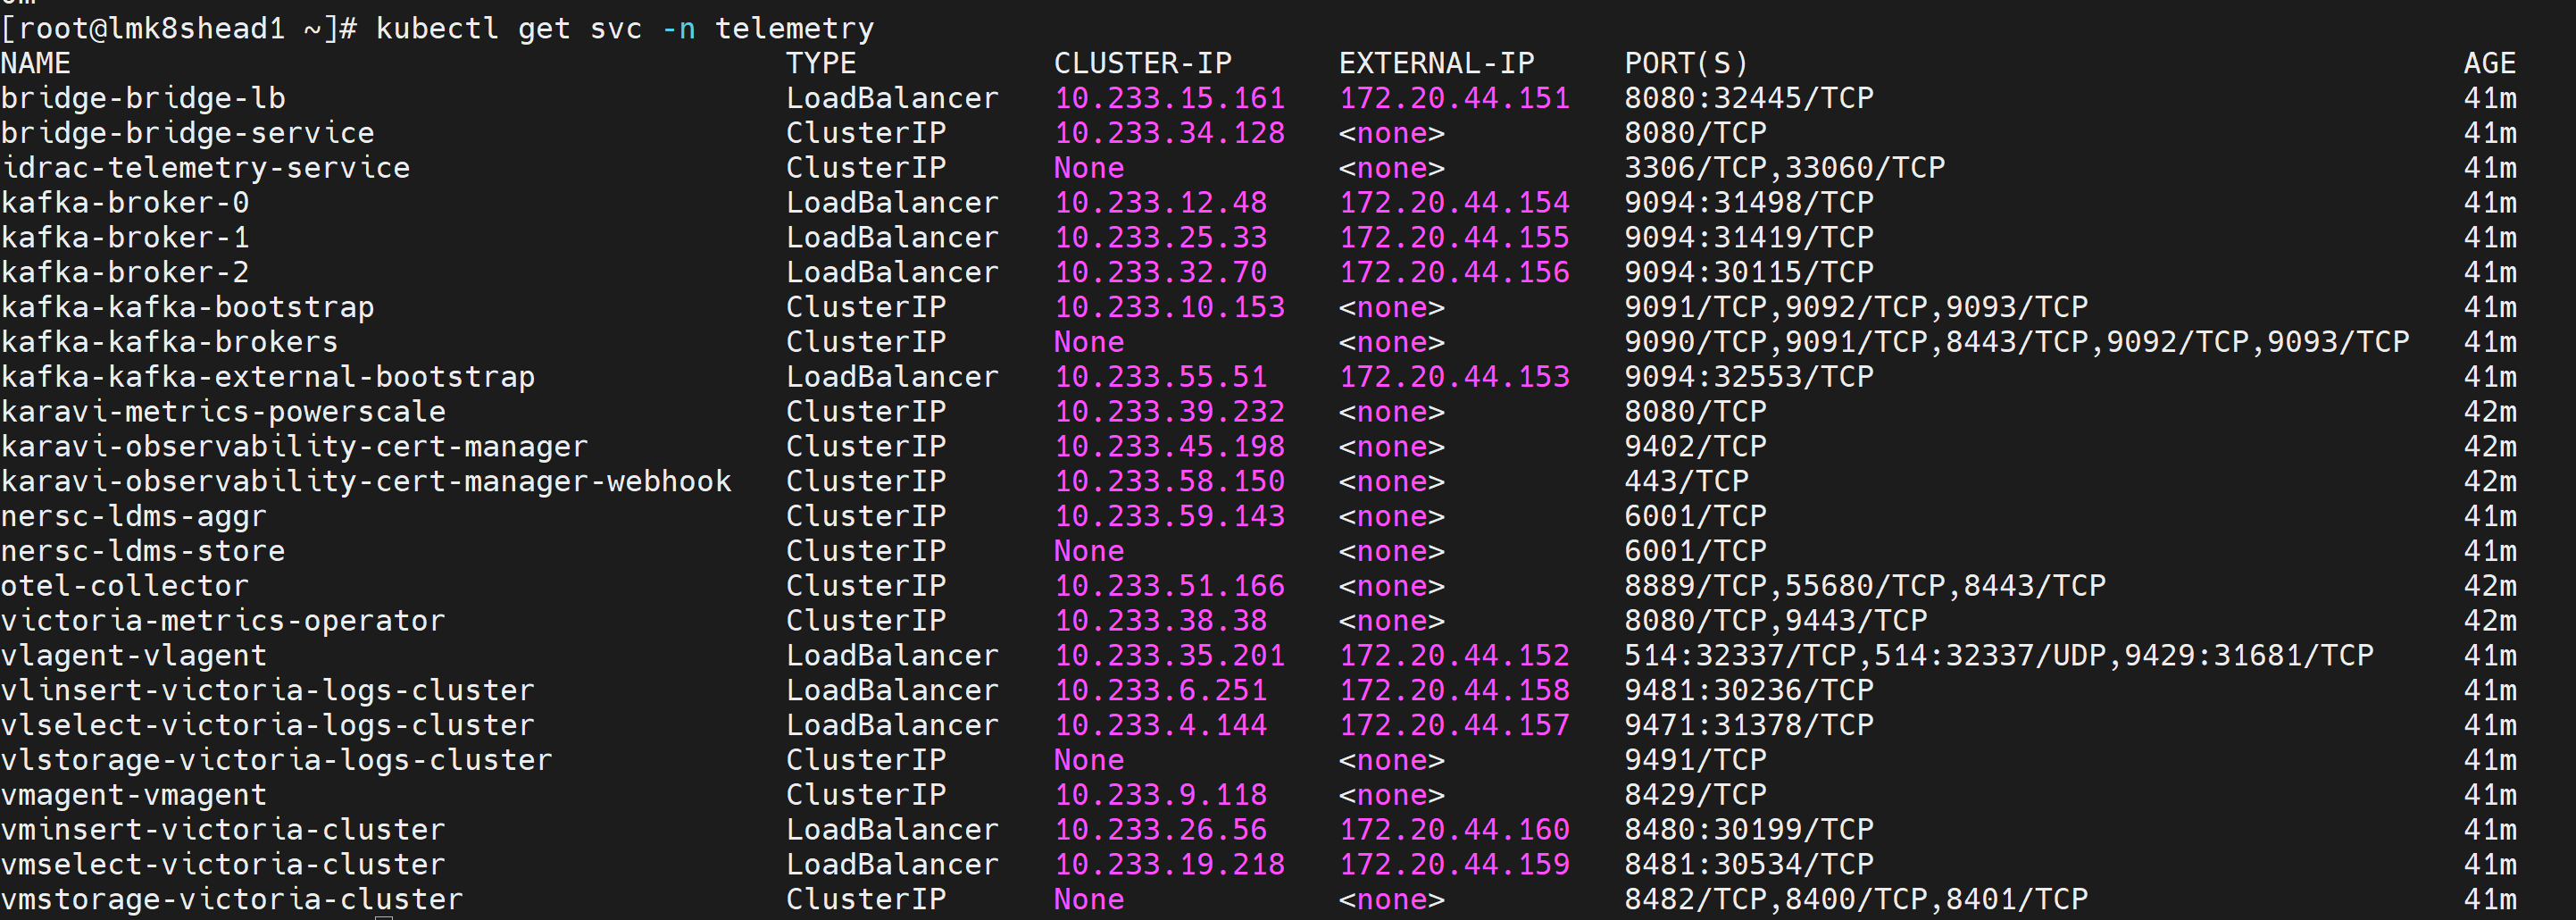
Ensure the following service entries exist:
- iDRAC Telemetry service
- Kafka broker, controller (bootstrap), and bridge services
- LDMS aggregator and store services
- VictoriaMetrics service
- vmagent-vector service
- Vector-LDMS service
- Vector-OME service
- vlagent-vector service
- VictoriaLogs service
- PowerScale Telemetry service
The following is the sample output:
Verify iDRAC Telemetry Flow
Verify iDRAC Telemetry Messages in Kafka
To verify that iDRAC telemetry data is being successfully published to the idrac Kafka topic:
-
Log in to the Service Kubernetes control plane.
-
Set the required variables:
Run on K8s control planeKAFKA_LB_IP=<external IP of bridge-bridge-lb service> TOPIC=idrac GROUP=idrac-consumer-group INSTANCE=idrac-consumer-1 -
Create a Kafka consumer:
Run on K8s control planecurl -X POST http://$KAFKA_LB_IP:8080/consumers/idrac-consumer-group \ -H 'content-type: application/vnd.kafka.v2+json' \ -d '{ "name": "idrac-consumer-1", "format": "json", "auto.offset.reset": "earliest" }' -
View the list of iDRAC Kafka topics configured:
Run on K8s control planecurl -s -X GET "http://$KAFKA_LB_IP:8080/topics" | jq '.' -
Subscribe the consumer to the telemetry topic:
Run on K8s control planecurl -X POST http://$KAFKA_LB_IP:8080/consumers/idrac-consumer-group/instances/idrac-consumer-1/subscription \ -H 'content-type: application/vnd.kafka.v2+json' \ -d '{"topics": ["idrac"]}' -
Consume messages from the topic:
Run on K8s control planewhile true; do curl -X GET http://$KAFKA_LB_IP:8080/consumers/idrac-consumer-group/instances/idrac-consumer-1/records \ -H 'accept: application/vnd.kafka.json.v2+json' | jq '.' ; sleep 2; done
If telemetry metrics are collected correctly, the output contains JSON-formatted iDRAC telemetry records.
Verify VictoriaMetrics TLS Connectivity
To verify TLS connectivity for VictoriaMetrics, run the VictoriaMetrics TLS test job:
cd /<nfs client mount path of the service k8s cluster>/telemetry/deployments/test
kubectl apply -f victoria-tls-test-job.yaml
After the job completes, check the logs to confirm that the TLS connection is successful:
kubectl logs victoria-tls-test-xxx -n telemetry
Verify Kafka TLS Connectivity
To verify TLS connectivity for Kafka, run the Kafka TLS test job:
cd /<nfs client mount path of the service k8s cluster>/telemetry/deployments/test
kubectl apply -f kafka.tls_test_job.yaml
After the job completes, check the logs to confirm that the TLS connection is successful:
kubectl logs kafka-tls-test-xxx -n telemetry
View iDRAC Telemetry Data in VictoriaMetrics UI (VMUI)
After applying the telemetry.yml configuration using the VictoriaMetrics deployment mode as cluster, use the VMUI to validate that iDRAC telemetry data is being collected and stored successfully.
-
Verify that the VictoriaMetrics pod is running:
Run on K8s control planekubectl get pods -n telemetry -o wide | grep vm
-
Verify that the VictoriaMetrics service is running:
Run on K8s control planekubectl get service -n telemetry | grep vm
-
Note the External IP and port number of the VictoriaMetrics service.
-
Access the VMUI in a web browser:
https://<external vmselect loadbalancer IP>:8481/select/0/vmui -
Filter and view telemetry metrics using queries in VMUI. For example, the following
PowerEdge_TemperatureReadingquery displays all available metrics: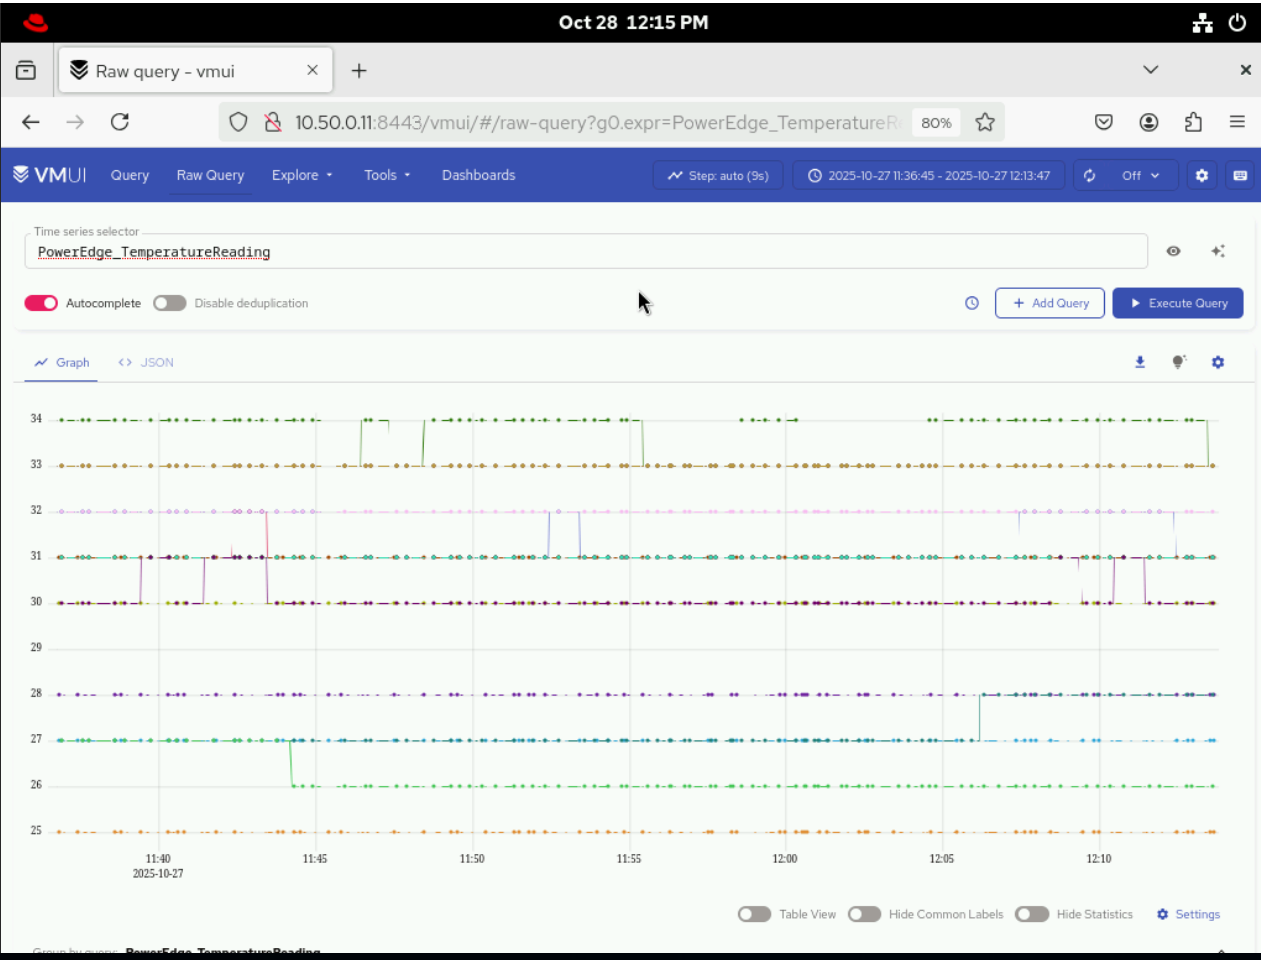
Verify LDMS Telemetry Flow
Verify LDMS Messages in Kafka
To verify that LDMS telemetry data is being successfully published to the ldms Kafka topic:
-
Log in to the Service Kubernetes control plane.
-
Set the required variables:
Run on K8s control planeKAFKA_LB_IP=<external IP of bridge-bridge-lb service> TOPIC=ldms GROUP=ldms-consumer-group INSTANCE=ldms-consumer-1 -
Create a Kafka consumer:
Run on K8s control planecurl -X POST http://$KAFKA_LB_IP:8080/consumers/ldms-consumer-group \ -H 'content-type: application/vnd.kafka.v2+json' \ -d '{ "name": "ldms-consumer-1", "format": "json", "auto.offset.reset": "latest", "enable.auto.commit": true }' -
View the list of LDMS Kafka topics configured:
Run on K8s control planecurl -s -X GET "http://$KAFKA_LB_IP:8080/topics" | jq '.' -
Subscribe the consumer to the LDMS topic:
Run on K8s control planecurl -X POST http://$KAFKA_LB_IP:8080/consumers/ldms-consumer-group/instances/ldms-consumer-1/subscription \ -H 'content-type: application/vnd.kafka.v2+json' \ -d '{"topics": ["ldms"]}' -
Consume messages from the topic:
Run on K8s control planewhile true; do curl -X GET http://$KAFKA_LB_IP:8080/consumers/ldms-consumer-group/instances/ldms-consumer-1/records \ -H 'accept: application/vnd.kafka.json.v2+json' | jq '.' ; sleep 2; done
If telemetry is flowing correctly, the output contains JSON-formatted LDMS telemetry records.
Note
When new nodes are added, ensure the nodes are up and cloud-init has completed successfully (check /var/log/cloud-init-output.log on each node). Then, create a new Kafka consumer group with a unique name (e.g., ldms-new-nodes-group) to verify metrics from the newly added nodes. Wait 2-3 minutes after discovery completes before checking.
Verify LDMS Metrics in VictoriaMetrics via Vector
To verify that LDMS telemetry data is being successfully consumed from Kafka by Vector-LDMS and routed to VictoriaMetrics:
-
Verify that the Vector-LDMS pod is running:
Run on K8s control planekubectl get pods -n telemetry | grep vector-ldms
-
Verify that the vmagent-vector pod is running:
Run on K8s control planekubectl get pods -n telemetry | grep vmagent-vector
-
Verify that the VictoriaMetrics service is running:
Run on K8s control planekubectl get service -n telemetry | grep vm
-
Note the External IP and port number of the VictoriaMetrics service.
-
Access the VMUI in a web browser:
https://<external vmselect loadbalancer IP>:8481/select/0/vmui -
Verify that metrics are reaching VictoriaMetrics by querying the VMUI. For example, the following query displays LDMS-related metrics:
{__name__=~"ldms_.*"}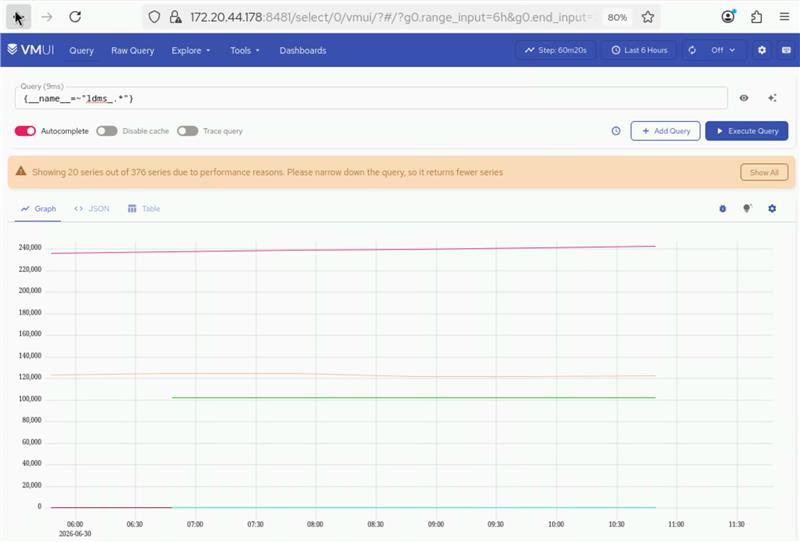
Verify Kafka TLS Connectivity (LDMS)
To verify TLS connectivity for Kafka, run the Kafka TLS test job:
cd /<nfs client mount path of the service k8s cluster>/telemetry/deployments/test
kubectl apply -f kafka.tls_test_job.yaml
After the job completes, check the logs to confirm that the TLS connection is successful:
kubectl logs kafka-tls-test-xxx -n telemetry
Verify PowerScale Telemetry Flow
View PowerScale Telemetry Data in VictoriaMetrics UI (VMUI)
After applying the telemetry.yml configuration using the VictoriaMetrics deployment mode as cluster, use the VMUI to validate that PowerScale telemetry data is being collected and stored successfully.
-
Verify that the VictoriaMetrics pod is running:
Run on K8s control planekubectl get pods -n telemetry -o wide | grep vm -
Verify that the VictoriaMetrics service is running:
Run on K8s control planekubectl get service -n telemetry -o wide | grep vm -
Note the External IP and port number of the VictoriaMetrics service.
-
Access the VMUI in a web browser:
https://<external vmselect loadbalancer IP>:8481/select/0/vmui -
Filter and view telemetry metrics using queries in VMUI. For example, the following query displays detailed PowerScale metrics for each hardware component:
{__name__=~"powerscale"}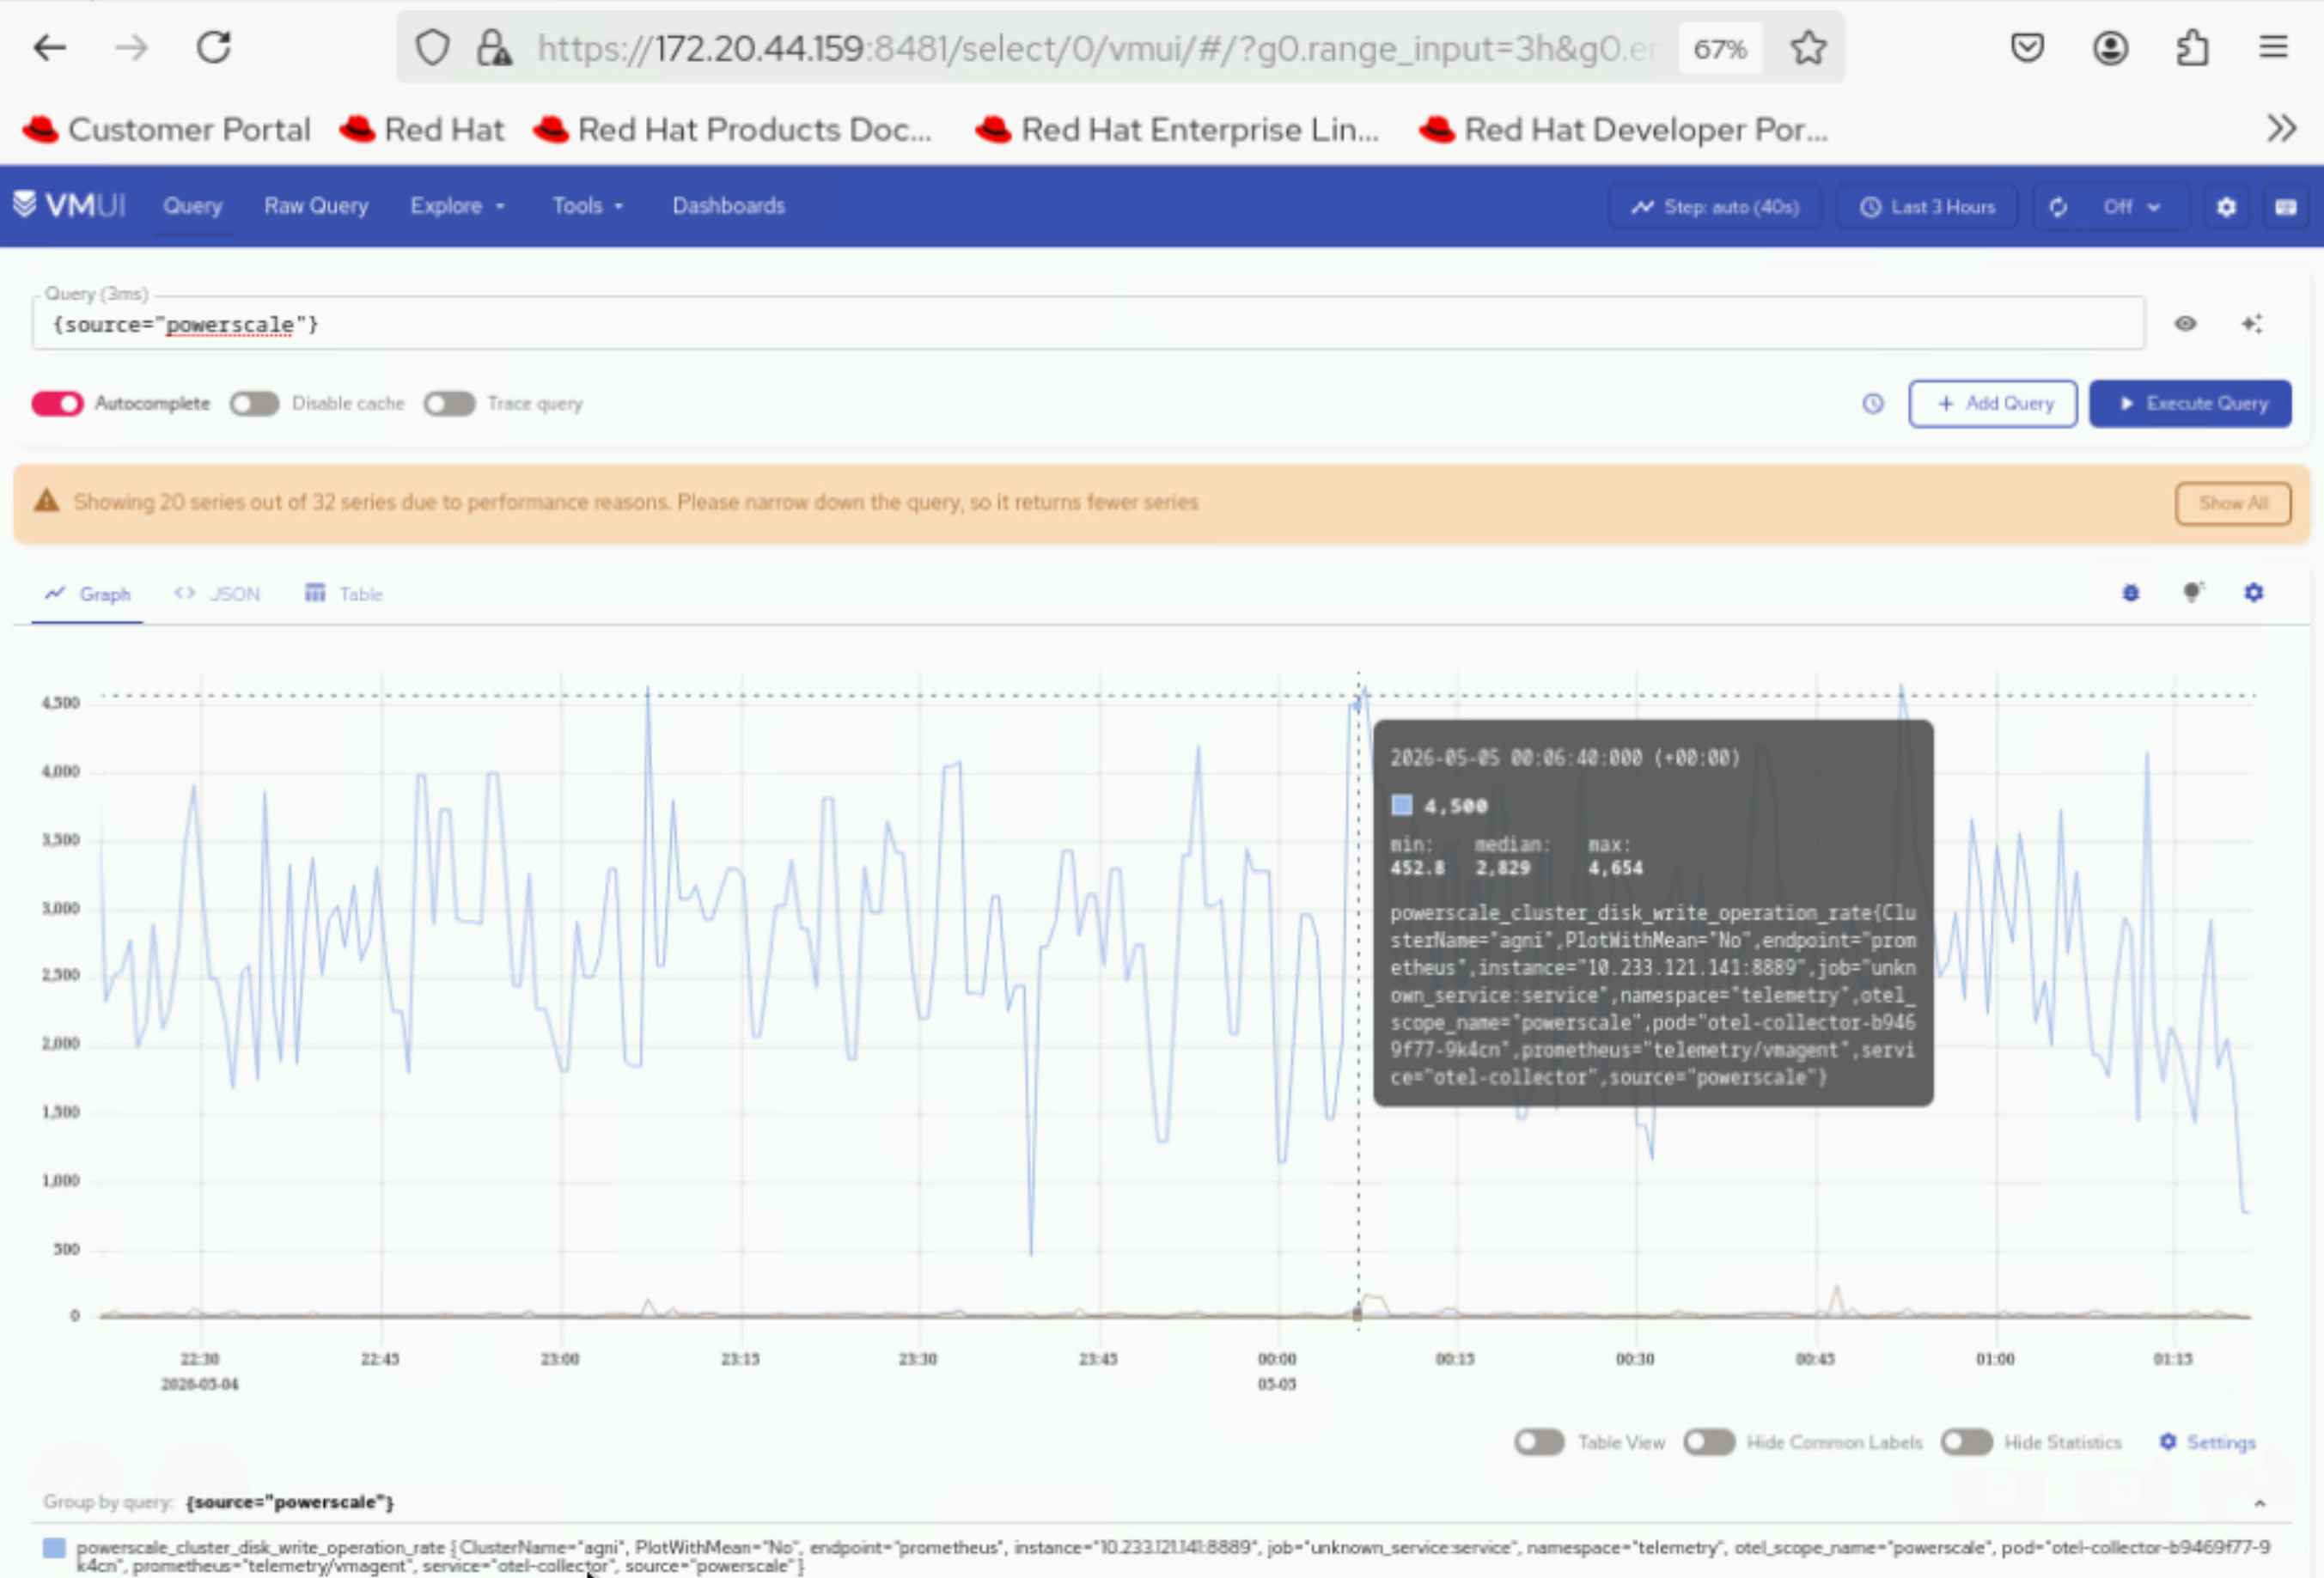
View PowerScale Logs in VictoriaLogs UI
After applying the telemetry.yml configuration using the VictoriaLogs deployment mode as cluster, use the VictoriaLogs UI to validate that PowerScale log data is being collected.
-
Verify that the VictoriaLogs pods are running:
Run on K8s control planekubectl get pods -n telemetry -o wide | grep vl
-
Verify that the VictoriaLogs service is running:
Run on K8s control planekubectl get service -n telemetry -o wide | grep vl
-
Note the External IP and port number of the VictoriaLogs service.
-
Access the VictoriaLogs UI in a web browser:
https://<external vlselect loadbalancer IP>:9471/select/vmui -
Filter and view PowerScale logs using queries in VictoriaLogs UI. For example, use the
*query to display all logs.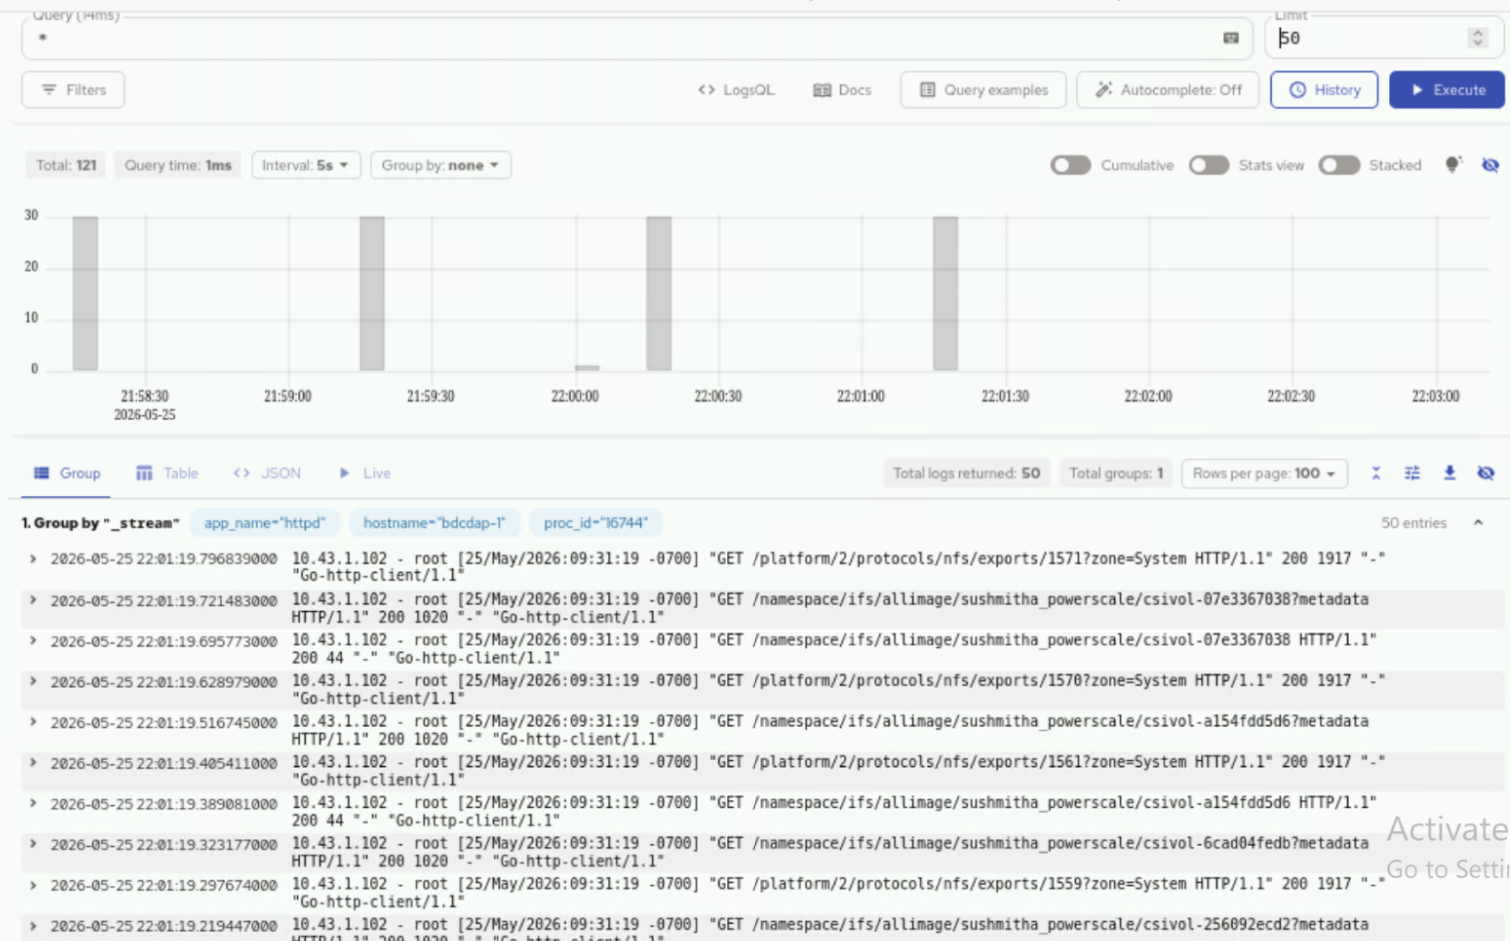
Verify UFM Telemetry Flow
View UFM Telemetry Data in VictoriaMetrics UI (VMUI)
After applying the telemetry.yml configuration using the VictoriaMetrics deployment mode as cluster, use the VMUI to validate that UFM telemetry data is being collected.
-
Verify that the VictoriaMetrics pod is running:
Run on K8s control planekubectl get pods -n telemetry -o wide | grep vm
-
Verify that the VictoriaMetrics service is running:
Run on K8s control planekubectl get service -n telemetry -o wide | grep vm
-
Verify VMagent logs for UFM scraping to view recent logs:
Run on K8s control planeVMAGENT_POD=$(kubectl get pods -n telemetry -l app.kubernetes.io/name=vmagent -o jsonpath='{.items[0].metadata.name}') kubectl logs $VMAGENT_POD -n telemetry -c vmagent --tail=50
-
Note the External IP and port number of the VictoriaMetrics service:
Run on K8s control planekubectl get svc -n telemetry | grep vmselect
-
Access the VMUI in a web browser:
https://<external vmselect loadbalancer IP>:8481/select/vmui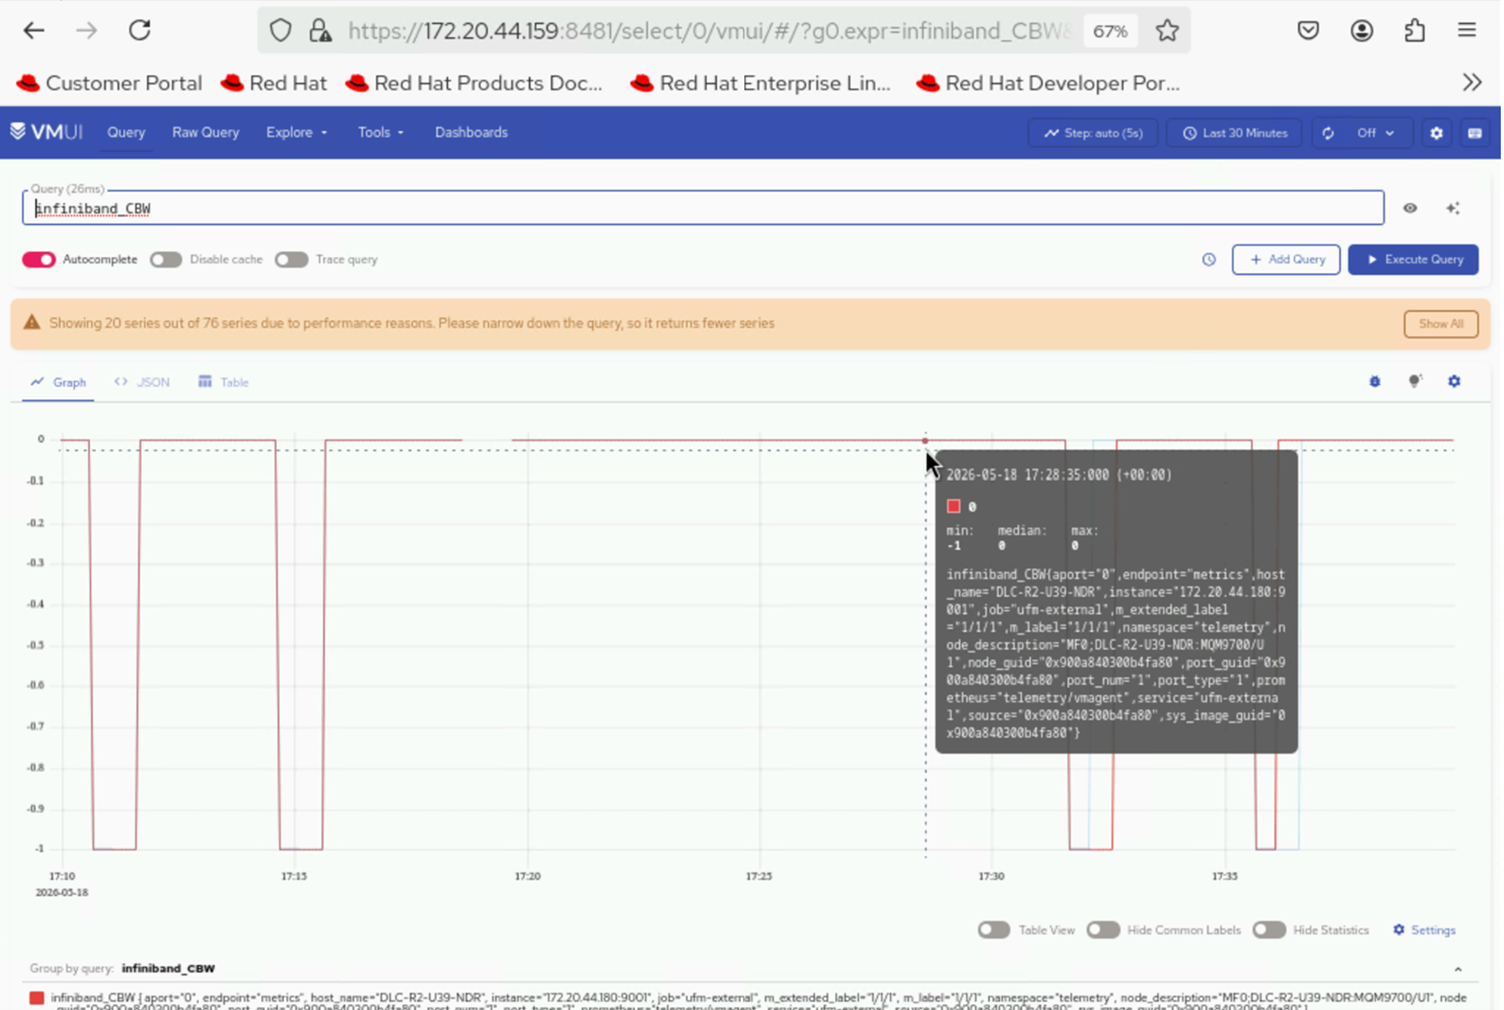
-
Filter and view UFM InfiniBand metrics using queries in VMUI. For example:
{source="ufm", subsystem="infiniband"}
View UFM Logs in VictoriaLogs
-
Retrieve the VLAgent LoadBalancer IP and configure it on the UFM appliance:
Run on K8s control planekubectl get svc -n telemetry | grep -E "(vlagent|victoria-logs)"
-
Retrieve the external IP and port of the vlselect service:
Run on K8s control planekubectl get svc -n telemetry | grep vlselect
-
Access the VictoriaLogs UI in a web browser:
https://<external vlselect loadbalancer IP>:9471/select/0/vmui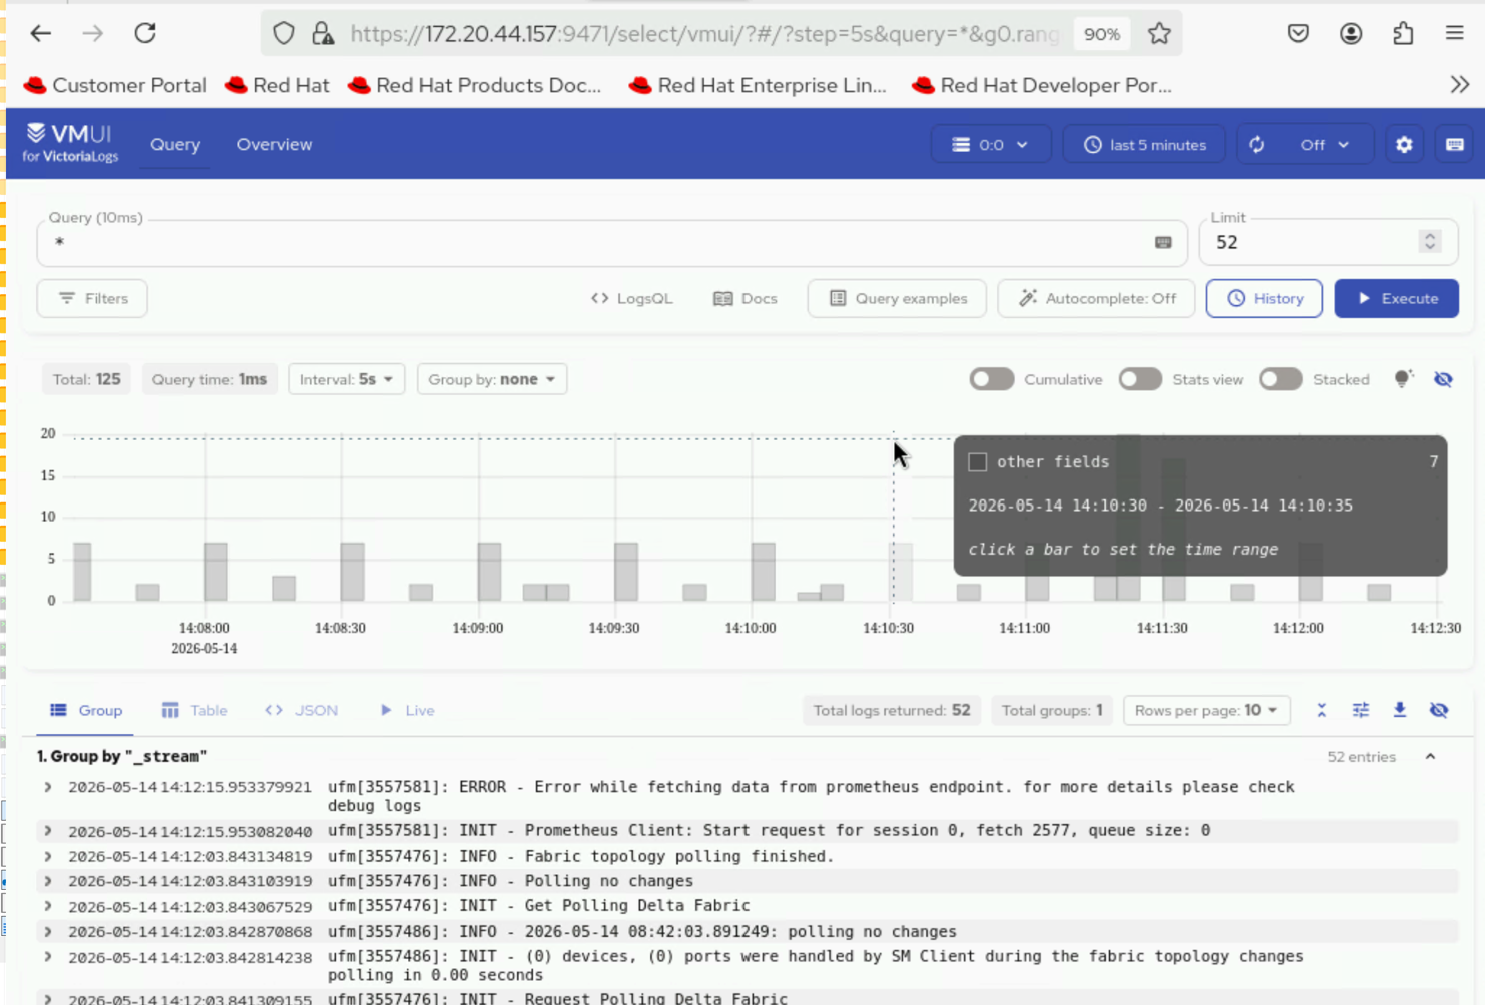
Verify VAST Telemetry Flow
View VAST Telemetry Data in VictoriaMetrics UI (VMUI)
After applying the telemetry.yml configuration using the VictoriaMetrics deployment mode as cluster, use the VMUI to validate that VAST telemetry data is being collected.
-
Verify that the VictoriaMetrics pod is running:
Run on K8s control planekubectl get pods -n telemetry -o wide | grep vm
-
Verify that the VictoriaMetrics service is running:
Run on K8s control planekubectl get service -n telemetry -o wide | grep vm

-
Verify VMagent logs for VAST scraping to view recent logs:
Run on K8s control planeVMAGENT_POD=$(kubectl get pods -n telemetry -l app.kubernetes.io/name=vmagent -o jsonpath='{.items[0].metadata.name}') kubectl logs $VMAGENT_POD -n telemetry -c vmagent --tail=10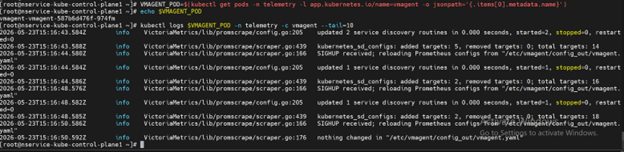
-
Note the External IP and port number of the VictoriaMetrics service:
Run on K8s control planekubectl get svc -n telemetry | grep vmselect
-
Access the VMUI in a web browser:
https://<external vmselect loadbalancer IP>:8481/select/0/vmui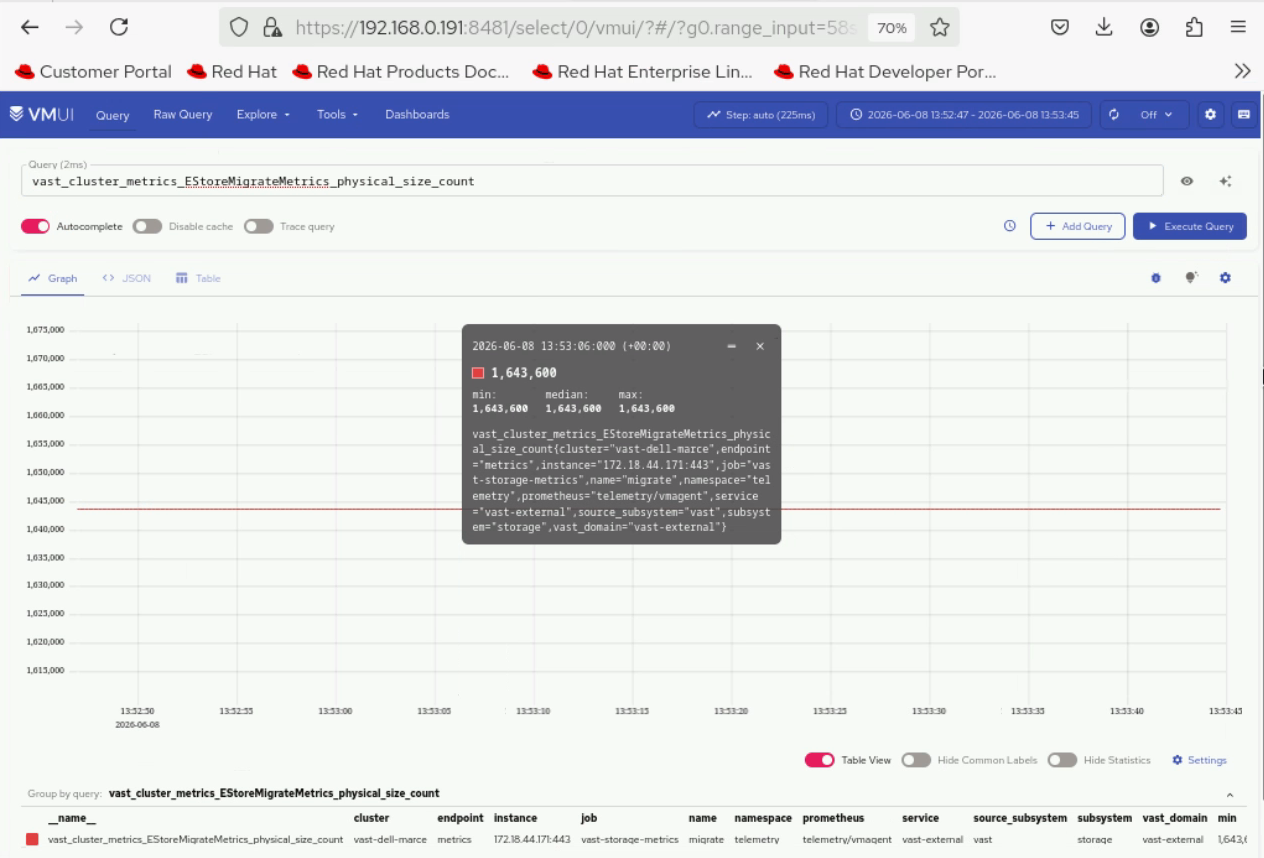
View VAST Logs in VictoriaLogs
-
Retrieve the VLAgent LoadBalancer IP and configure it on the VAST appliance:
Run on K8s control planekubectl get svc -n telemetry | grep -E "(vlagent|victoria-logs)"
-
Retrieve the external IP and port of the vlselect service:
Run on K8s control planekubectl get svc -n telemetry | grep vlselect
-
Access the VictoriaLogs UI in a web browser:
https://<external vlselect loadbalancer IP>:9471/select/vmui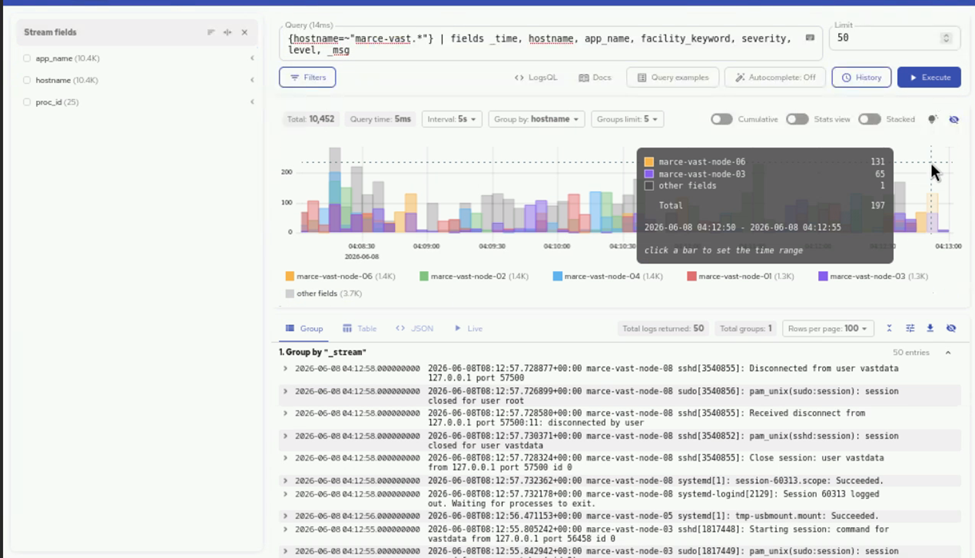
Verify OME Telemetry Flow
Verify OME Telemetry Data in Kafka
To verify that OME telemetry data is being successfully published to the OME Kafka topics:
Note
Ensure that the nodes are discovered in OpenManage Enterprise before configuring telemetry streaming.
-
Log in to the Service Kubernetes control plane.
-
Set the required variables:
Run on K8s control planeKAFKA_LB_IP=<external IP of bridge-bridge-lb service> TOPIC=<OME Topic Name> GROUP=ome-consumer-group INSTANCE=ome-consumer -
Create a Kafka consumer:
Run on K8s control planecurl -s -X POST "http://$KAFKA_LB_IP:8080/consumers/$GROUP" \ -H 'content-type: application/vnd.kafka.v2+json' \ -d '{"name": "ome-consumer", "format": "json", "auto.offset.reset": "earliest"}' -
View the list of OME Kafka topics configured:
Run on K8s control planecurl -s -X GET "http://$KAFKA_LB_IP:8080/topics" | jq '.' -
Subscribe the consumer to the telemetry topic:
Run on K8s control planecurl -s -X POST "http://$KAFKA_LB_IP:8080/consumers/$GROUP/instances/$INSTANCE/subscription" \ -H 'content-type: application/vnd.kafka.v2+json' \ -d '{"topics": ["'"$TOPIC"'"]}' -
Consume messages from the topic:
Run on K8s control planewhile true; do curl -s -X GET "http://$KAFKA_LB_IP:8080/consumers/$GROUP/instances/$INSTANCE/records" \ -H 'accept: application/vnd.kafka.json.v2+json' | jq '.' sleep 2 done -
(Optional) Cleanup the consumer:
Run on K8s control planecurl -s -X DELETE "http://$KAFKA_LB_IP:8080/consumers/$GROUP/instances/$INSTANCE"
Note
- From beginning: Ensure
"auto.offset.reset": "earliest"when creating the consumer if you want existing data. - Message format: Use
"format": "json"only if producers publish JSON. Otherwise use"binary"and decode base64 payloads. - Throughput: Adjust polling interval; bridge returns empty array when no new records.
- 404/409 errors: 404 usually means wrong group/instance name; 409 means already subscribed.
Verify OME Telemetry Data in VictoriaMetrics
To verify that OME telemetry data is being successfully routed from Kafka to VictoriaMetrics using Vector:
-
Access the VMUI in a web browser:
https://<external vmselect loadbalancer IP>:8481/select/0/vmui -
Navigate to the Explore tab.
-
Run the following query to retrieve health metrics from OME:
last_over_time({source_subsystem="ome", type="healty"}[24h])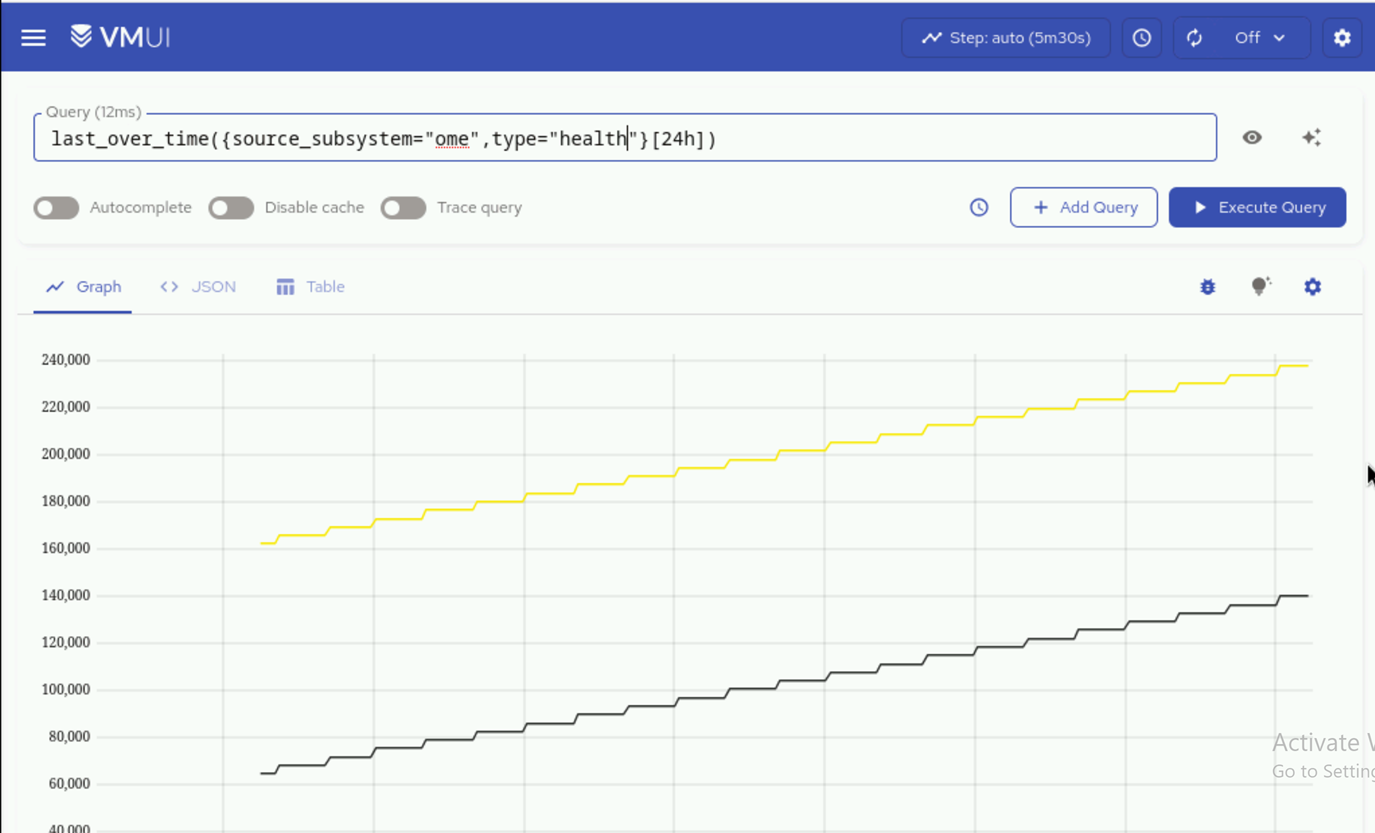
Note
source_subsystem=ome comes from the ome_identifier that the user has given in the telemetry_config.yml input file and the suffix after the dot (i.e., health, inventory, auditlogs) is coming from OME.
- Verify that OME-related metrics are displayed in the results.
Note
Ensure that the Vector-OME bridge is enabled in telemetry_config.yml (telemetry_bridges > vector_ome > metrics_enabled: true) for metrics data to flow from Kafka to VictoriaMetrics.
Verify OME Telemetry Data in VictoriaLogs
To verify that OME telemetry data is being successfully routed from Kafka to VictoriaLogs using Vector:
-
Access the VictoriaLogs UI in a web browser:
https://<external vlselect loadbalancer IP>:9471/select/vmui -
Navigate to the Select tab.
-
In the query field, run the following query to filter for OME logs:
_msg_topic:ome.auditlogs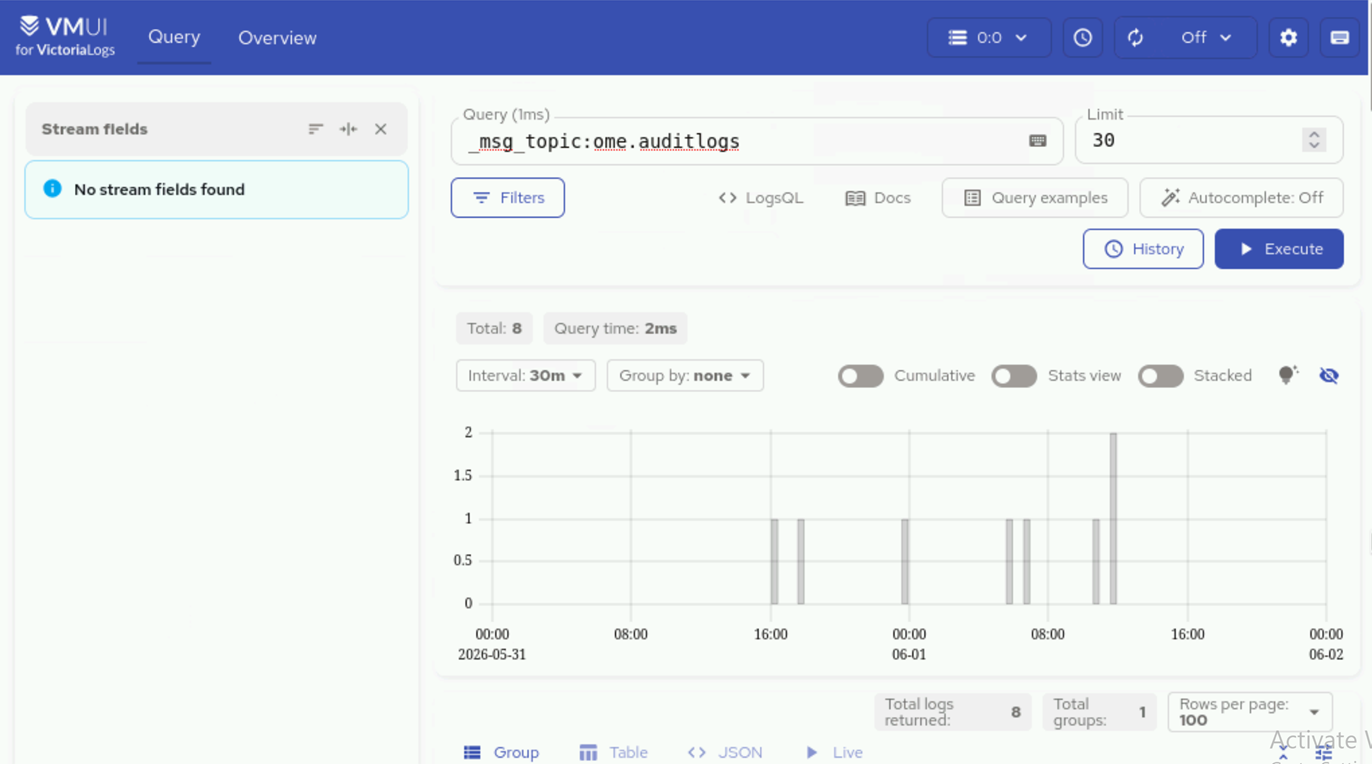
-
Verify that OME-related logs are displayed in the results.
Note
Ensure that the Vector-OME bridge is enabled in telemetry_config.yml (telemetry_bridges > vector_ome > logs_enabled: true) for logs data to flow from Kafka to VictoriaLogs.
Verify SFM Telemetry Flow
View SFM Telemetry Data in VictoriaMetrics UI (VMUI)
To view the SFM telemetry data that is streamed to VictoriaMetrics:
-
Verify that the VictoriaMetrics pod is running:
Run on K8s control planekubectl get pods -n telemetry -o wide | grep vm -
Verify that all the services of VictoriaMetrics cluster are running:
Run on K8s control planekubectl get service -n telemetry -o wide | grep vm -
Note the External IP and port number of the
vmselectservice. -
Access the VMUI in a web browser:
https://<external vmselect loadbalancer IP>:8481/select/0/vmui -
Filter and view telemetry metrics using queries in VMUI. For example, the following query displays transceiver DOM temperature values:
transceiver_dom_temperature_value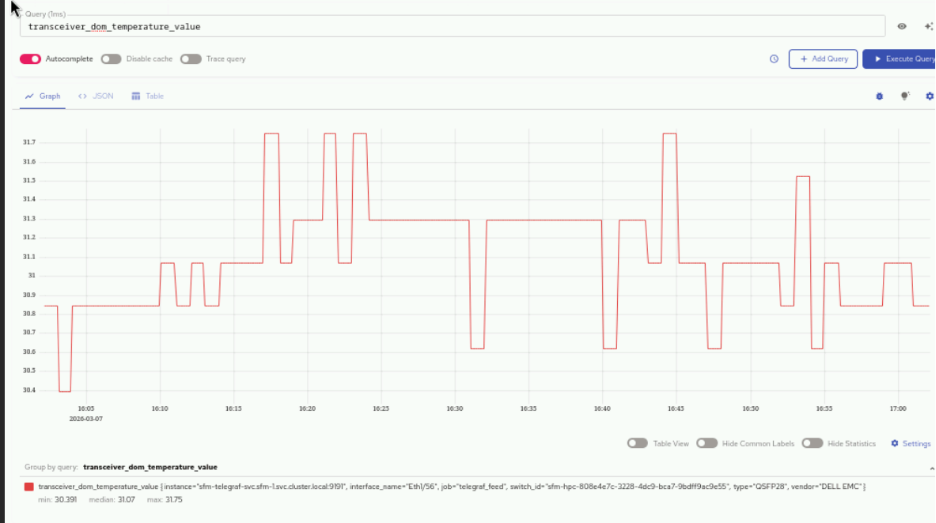
The following are some of the key metrics that can be queried:
transceiver_dom_temperature_value-- Monitors optical transceiver temperature for hardware healthqueue_tx_pkts-- Tracks transmitted packets per queue for performance monitoringqueue_drop_pkts-- Counts dropped packets per queue to identify congestion issuesqueue_tx_bits_per_second-- Measures queue throughput in bits per secondifcounters_in_octets-- Monitors incoming data volume in bytes per interfaceifcounters_out_octets-- Monitors outgoing data volume in bytes per interfaceifcounters_in_pkts-- Counts incoming packets per interfaceifcounters_out_pkts-- Counts outgoing packets per interfaceifcounters_in_errors-- Tracks input errors per interface for fault detectionifcounters_out_errors-- Tracks output errors per interface for fault detection
Access the MySQL Database
After telemetry.yml has been executed for the service cluster, you can check the MySQL database inside the mysqldb container.
-
Get the names of all the telemetry pods:
Run on K8s control planekubectl get pods -n telemetry -l app=idrac-telemetryNote
The
idrac-telemetry-0pod will always be responsible for collecting the telemetry data of the management nodes (oim,service_kube_control_plane_x86_64,service_kube_node_x86_64,login_node_x86_64, etc.). -
Execute the following command:
Run on K8s control planekubectl exec -it -n telemetry <iDRAC_telemetry_pod_name> -c mysqldb -- mysql -u <MYSQL_USER> -p -
When prompted, enter the MySQL password to log in.
-
To enter into the
idrac_telemetry_db:use idrac_telemetrydb; -
To access the services table:
select * from services;
Quick Reference Checklist
| Telemetry Source | Verification Check | Expected Result |
|---|---|---|
| Component Status | kubectl get pods -n telemetry |
All pods Running |
| Component Status | kubectl get svc -n telemetry |
All services present |
| iDRAC | Kafka consumer on idrac topic |
JSON telemetry records |
| iDRAC | VMUI query: PowerEdge_TemperatureReading |
Metric data displayed |
| LDMS | Kafka consumer on ldms topic |
JSON telemetry records |
| LDMS | VMUI query: {__name__=~"ldms_.*"} |
LDMS metrics displayed |
| PowerScale | VMUI query: {__name__=~"powerscale"} |
PowerScale metrics displayed |
| PowerScale | VictoriaLogs UI query: * |
PowerScale logs displayed |
| UFM | VMUI query: {source="ufm", subsystem="infiniband"} |
UFM metrics displayed |
| VAST | VMUI query for VAST metrics | VAST metrics displayed |
| OME | Kafka consumer on OME topics | JSON telemetry records |
| OME | VMUI query: last_over_time({source_subsystem="ome"}[24h]) |
OME metrics displayed |
| SFM | VMUI query: transceiver_dom_temperature_value |
SFM metrics displayed |
Next Steps
- Configure LDMS -- Set up LDMS telemetry.
- Configure PowerScale Telemetry -- Set up PowerScale telemetry.
- Configure UFM Telemetry -- Set up UFM telemetry.
- Configure VAST Telemetry -- Set up VAST telemetry.
- External Kafka -- Stream data from external clients to Kafka.
- External VictoriaMetrics -- Push metrics from external clients to VictoriaMetrics.