Initialize and Verify Telemetry
Initialize telemetry services for monitoring the cluster and verify data collection. This procedure covers iDRAC telemetry setup, external node collection, Kafka message validation, TLS connectivity tests, and VictoriaMetrics/VictoriaLogs verification.
Overview
Telemetry collection enables you to gather performance metrics and system health data from cluster nodes. BuildStreaM does not automate telemetry invocation and data collection. You must perform all steps in this guide manually on the OIM.
Prerequisites
- Deploy pipeline has completed successfully and nodes are powered on
- Nodes are accessible via BMC
- Service cluster is deployed with Kubernetes running
Procedure
Run the Telemetry Playbook
-
Run the
telemetry.ymlplaybook to initiate the iDRAC telemetry service on the service cluster:Run on: omnia_core containercd /omnia/telemetry ansible-playbook telemetry.yml
Note
Service cluster metadata automatically captures the service cluster kube control plane virtual IP. The telemetry.yml playbook is executed against the VIP rather than an individual control plane node.
Note
You do not need to run telemetry.yml if the service cluster is configured only for LDMS. By default, LDMS begins collecting data after the nodes are deployed with the appropriate configuration.
Collect Telemetry from External Nodes
To collect telemetry from external nodes:
-
Update the BMC IP of the external nodes in
/opt/omnia/telemetry/bmc_group_data.csv. Leave theGROUP_NAMEandPARENTfields blank.File: bmc_group_data.csvBMC_IP,GROUP_NAME,PARENT <IP Address>,, -
Run the
telemetry.ymlplaybook:Run on: omnia_core containeransible-playbook telemetry.yml
Verification
Verify Telemetry Pods Are Running
-
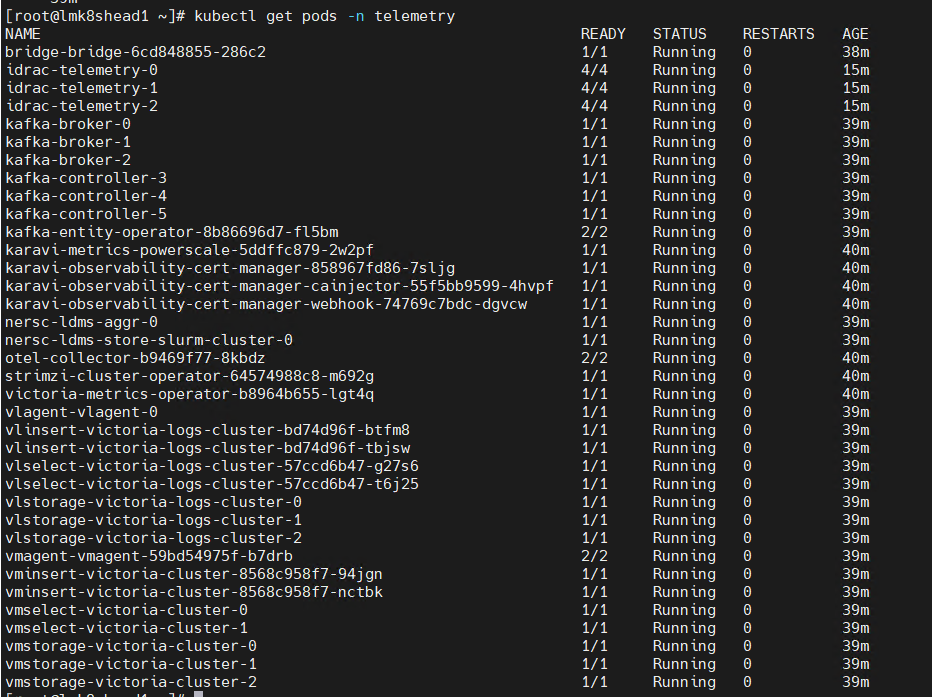
Run the following command:
Run on: Service Kubernetes Control planekubectl get pods -n telemetry -
Ensure the following pods are in a running state:
- iDRAC Telemetry pods
- Kafka broker, controller, and operator pods
- LDMS aggregator and store pods
- VictoriaMetrics and vmagent pods
- VictoriaLogs pods
- PowerScale Telemetry pods
Verify Kubernetes Telemetry Services
-
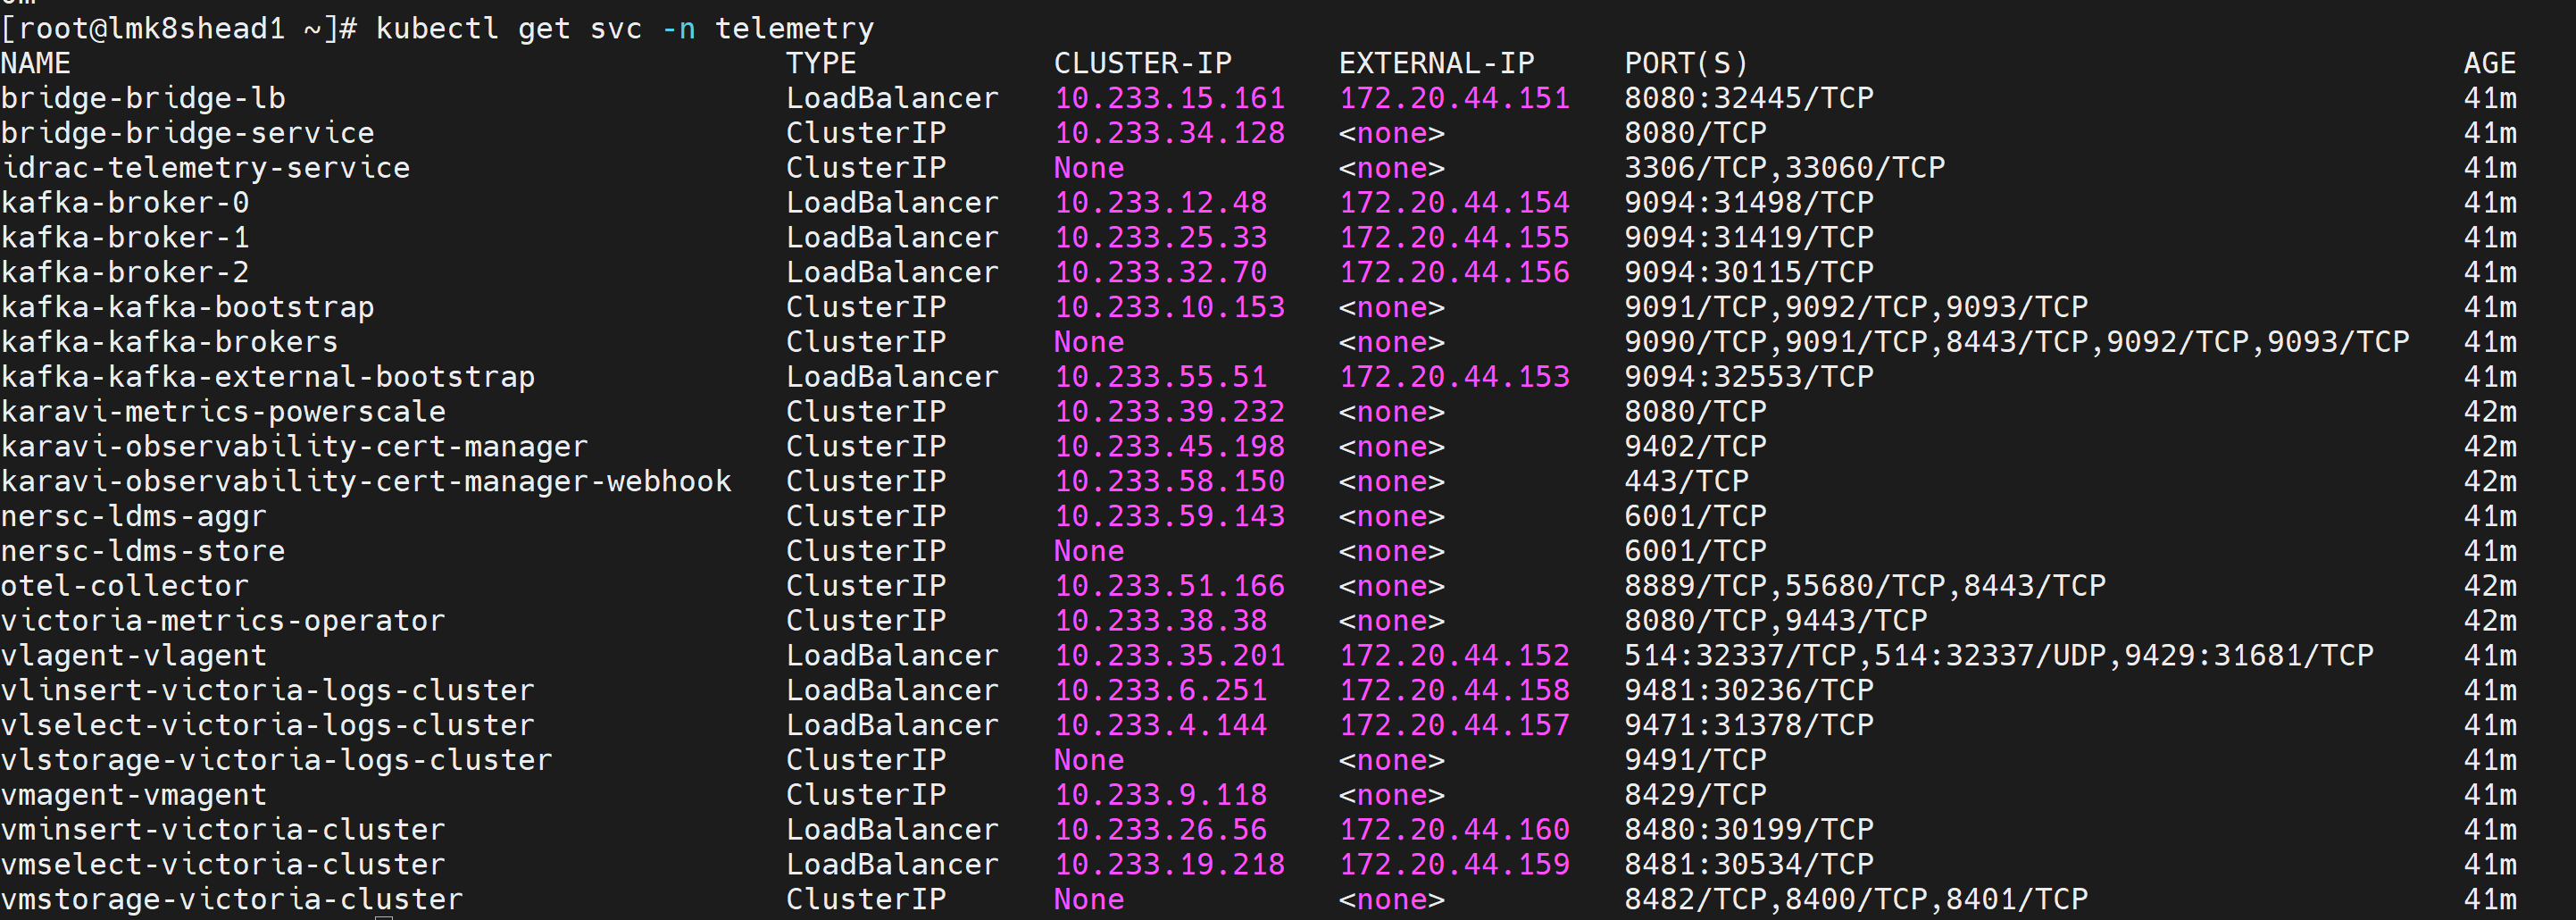
Run the following command:
Run on: Service Kubernetes Control planekubectl get svc -n telemetry -
Ensure the following service entries exist:
- iDRAC Telemetry service
- Kafka broker, controller (bootstrap), and bridge services
- LDMS aggregator and store services
- VictoriaMetrics service
- VictoriaLogs service
- PowerScale Telemetry service
Verify iDRAC Telemetry Messages in Kafka
-
Log in to the Service Kubernetes Control plane.
-
Create a Kafka consumer:
Run on: Service Kubernetes Control planeKAFKA_LB_IP=<external load balancer IP of the bridge-bridge-lb service> curl -X POST http://$KAFKA_LB_IP:8080/consumers/idrac-consumer-group \ -H 'content-type: application/vnd.kafka.v2+json' \ -d '{ "name": "idrac-consumer-1", "format": "json", "auto.offset.reset": "earliest" }' -
Subscribe the consumer to the telemetry topic:
Run on: Service Kubernetes Control planecurl -X POST http://$KAFKA_LB_IP:8080/consumers/idrac-consumer-group/instances/idrac-consumer-1/subscription \ -H 'content-type: application/vnd.kafka.v2+json' \ -d '{"topics": ["idrac"]}' -
Consume messages from the topic:
Run on: Service Kubernetes Control planewhile true; do curl -X GET http://$KAFKA_LB_IP:8080/consumers/idrac-consumer-group/instances/idrac-consumer-1/records \ -H 'accept: application/vnd.kafka.json.v2+json' | jq '.' ; sleep 2; done
If telemetry metrics are collected correctly, the output contains JSON-formatted iDRAC telemetry records.
Verify LDMS Messages in Kafka
-
Log in to the Service Kubernetes Control plane.
-
Create a Kafka consumer:
Run on: Service Kubernetes Control planeKAFKA_LB_IP=<external load balancer IP of the bridge-bridge-lb service> curl -X POST http://$KAFKA_LB_IP:8080/consumers/ldms-consumer-group \ -H 'content-type: application/vnd.kafka.v2+json' \ -d '{ "name": "ldms-consumer-1", "format": "json", "auto.offset.reset": "latest", "enable.auto.commit": true }' -
Subscribe the consumer to the LDMS topic:
Run on: Service Kubernetes Control planecurl -X POST http://$KAFKA_LB_IP:8080/consumers/ldms-consumer-group/instances/ldms-consumer-1/subscription \ -H 'content-type: application/vnd.kafka.v2+json' \ -d '{"topics": ["ldms"]}' -
Consume messages from the topic:
Run on: Service Kubernetes Control planewhile true; do curl -X GET http://$KAFKA_LB_IP:8080/consumers/ldms-consumer-group/instances/ldms-consumer-1/records \ -H 'accept: application/vnd.kafka.json.v2+json' | jq '.' ; sleep 2; done
If telemetry is flowing correctly, the output contains JSON-formatted LDMS telemetry records.
Note
When new nodes are added, ensure the nodes are up and cloud-init has completed successfully (check /var/log/cloud-init-output.log on each node). Then, create a new Kafka consumer group with a unique name to verify metrics from the newly added nodes. Wait 2-3 minutes after discovery completes before checking.
Verify Kafka TLS Connectivity
Run the Kafka TLS test job to verify that certificates, truststores, keystores, and mTLS communication are functioning correctly:
cd /<nfs client mount path of the service k8s cluster>/telemetry/deployments/test
kubectl apply -f kafka.tls_test_job.yaml
After the job completes, check the logs to confirm TLS connection:
kubectl logs kafka-tls-test-xxx -n telemetry
Verify VictoriaMetrics TLS Connectivity
Run the VictoriaMetrics TLS test job to verify certificates and secure connectivity:
cd /<nfs client mount path of the service k8s cluster>/telemetry/deployments/test
kubectl apply -f victoria-tls-test-job.yaml
After the job completes, check the logs:
kubectl logs victoria-tls-test-xxx -n telemetry
View Logs Using VictoriaLogs Query Interface
After applying telemetry.yml with idrac_telemetry_collection_type set to victoria:
-
Verify the VictoriaLogs vlselect pod is running:
Run on: Service Kubernetes Control planekubectl get pods -n telemetry -o wide | grep vlselect -
Verify the VictoriaLogs vlselect service is running:
Run on: Service Kubernetes Control planekubectl get service -n telemetry -o wide | grep vlselect -
Note the External IP and port number of the VictoriaLogs vlselect service.
-
Access the VictoriaLogs query interface:
VictoriaLogs query interface URLhttps://<external vlselect loadbalancer IP>:9471/select/vmui -
Filter and view logs using LogsQL queries. For example:
Example LogsQL query* | sort by time desc
View iDRAC Telemetry Data Using VictoriaMetrics UI (VMUI) - Cluster Mode Deployment
After applying telemetry.yml with VictoriaMetrics deployment mode as cluster:
-
Verify the VictoriaMetrics pod is running:
Run on: Service Kubernetes Control planekubectl get pods -n telemetry -o wide | grep vm
-
Verify the VictoriaMetrics service is running:
Run on: Service Kubernetes Control planekubectl get service -n telemetry -o wide | grep vm
-
Note the External IP and port number of the VictoriaMetrics service.
-
Access the VMUI:
VMUI URLhttps://<external vmselect loadbalancer IP>:8481/select/0/vmui -
Filter and view telemetry metrics. For example:
Example PromQL query{__name__=~"PowerEdge_.*"}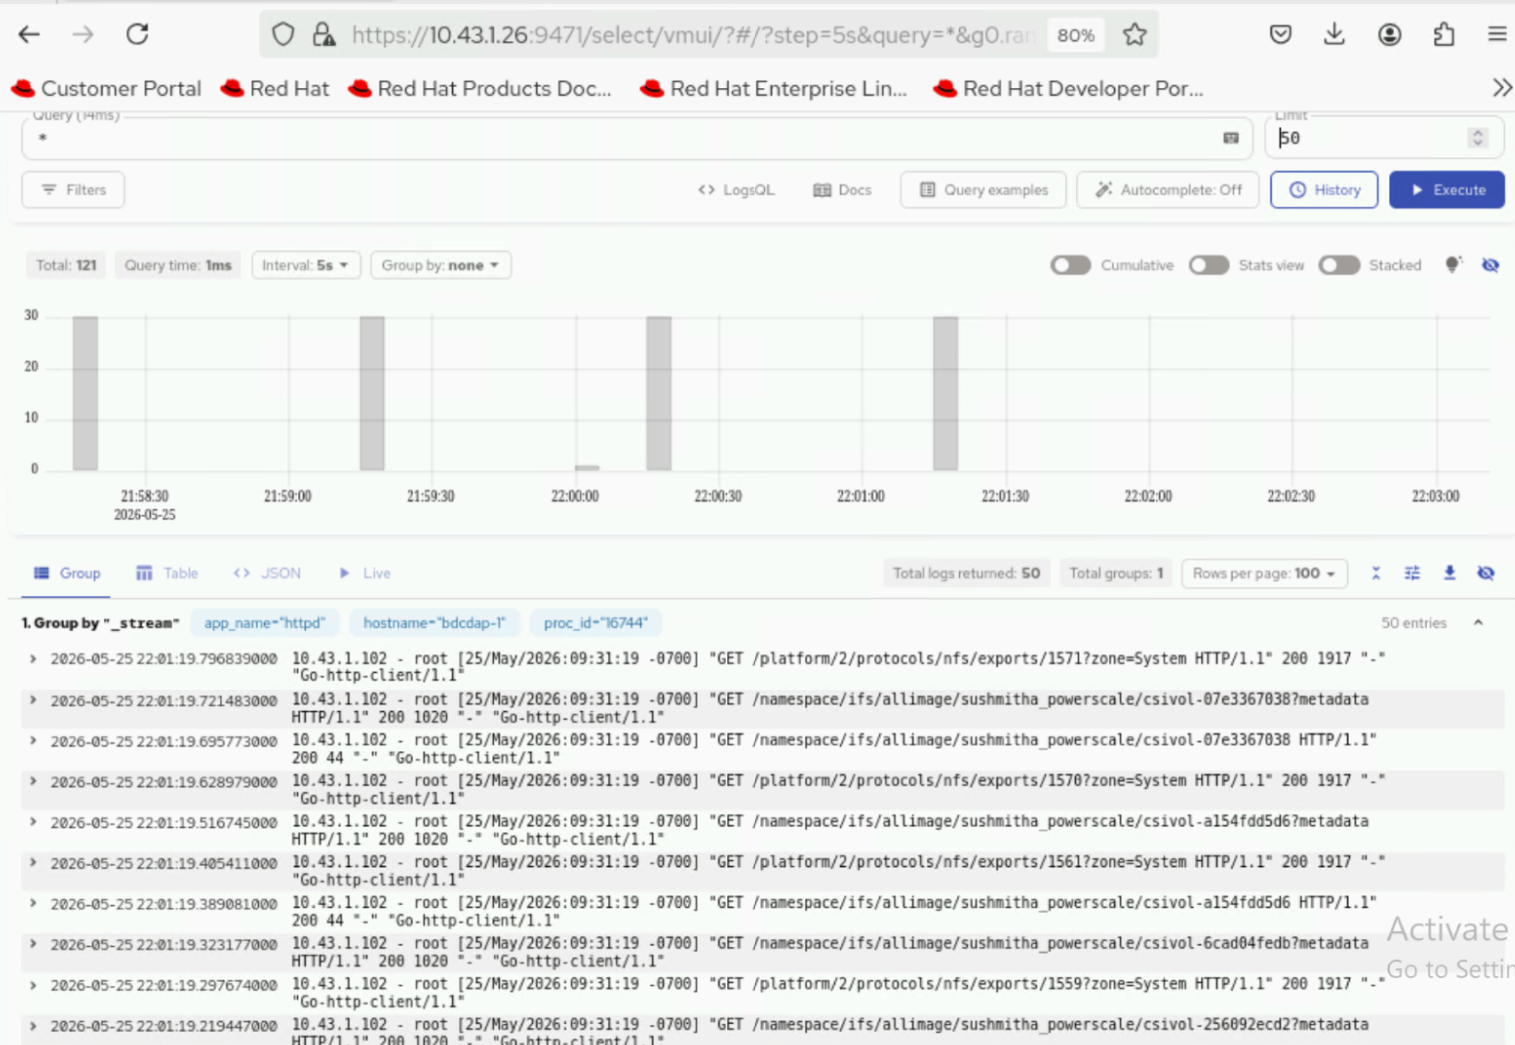
View PowerScale Telemetry Data Using VMUI (Cluster Mode)
After applying telemetry.yml with VictoriaMetrics deployment mode as cluster:
-
Verify the VictoriaMetrics pod is running:
Run on: Service Kubernetes Control planekubectl get pods -n telemetry -o wide | grep vm -
Verify the VictoriaMetrics service is running:
Run on: Service Kubernetes Control planekubectl get service -n telemetry -o wide | grep vm -
Verify the OTEL collector is receiving telemetry data:
Run on: Service Kubernetes Control planekubectl logs -n telemetry -l app.kubernetes.io/name=otel-collector --all-containers --tail=50 | grep -i metric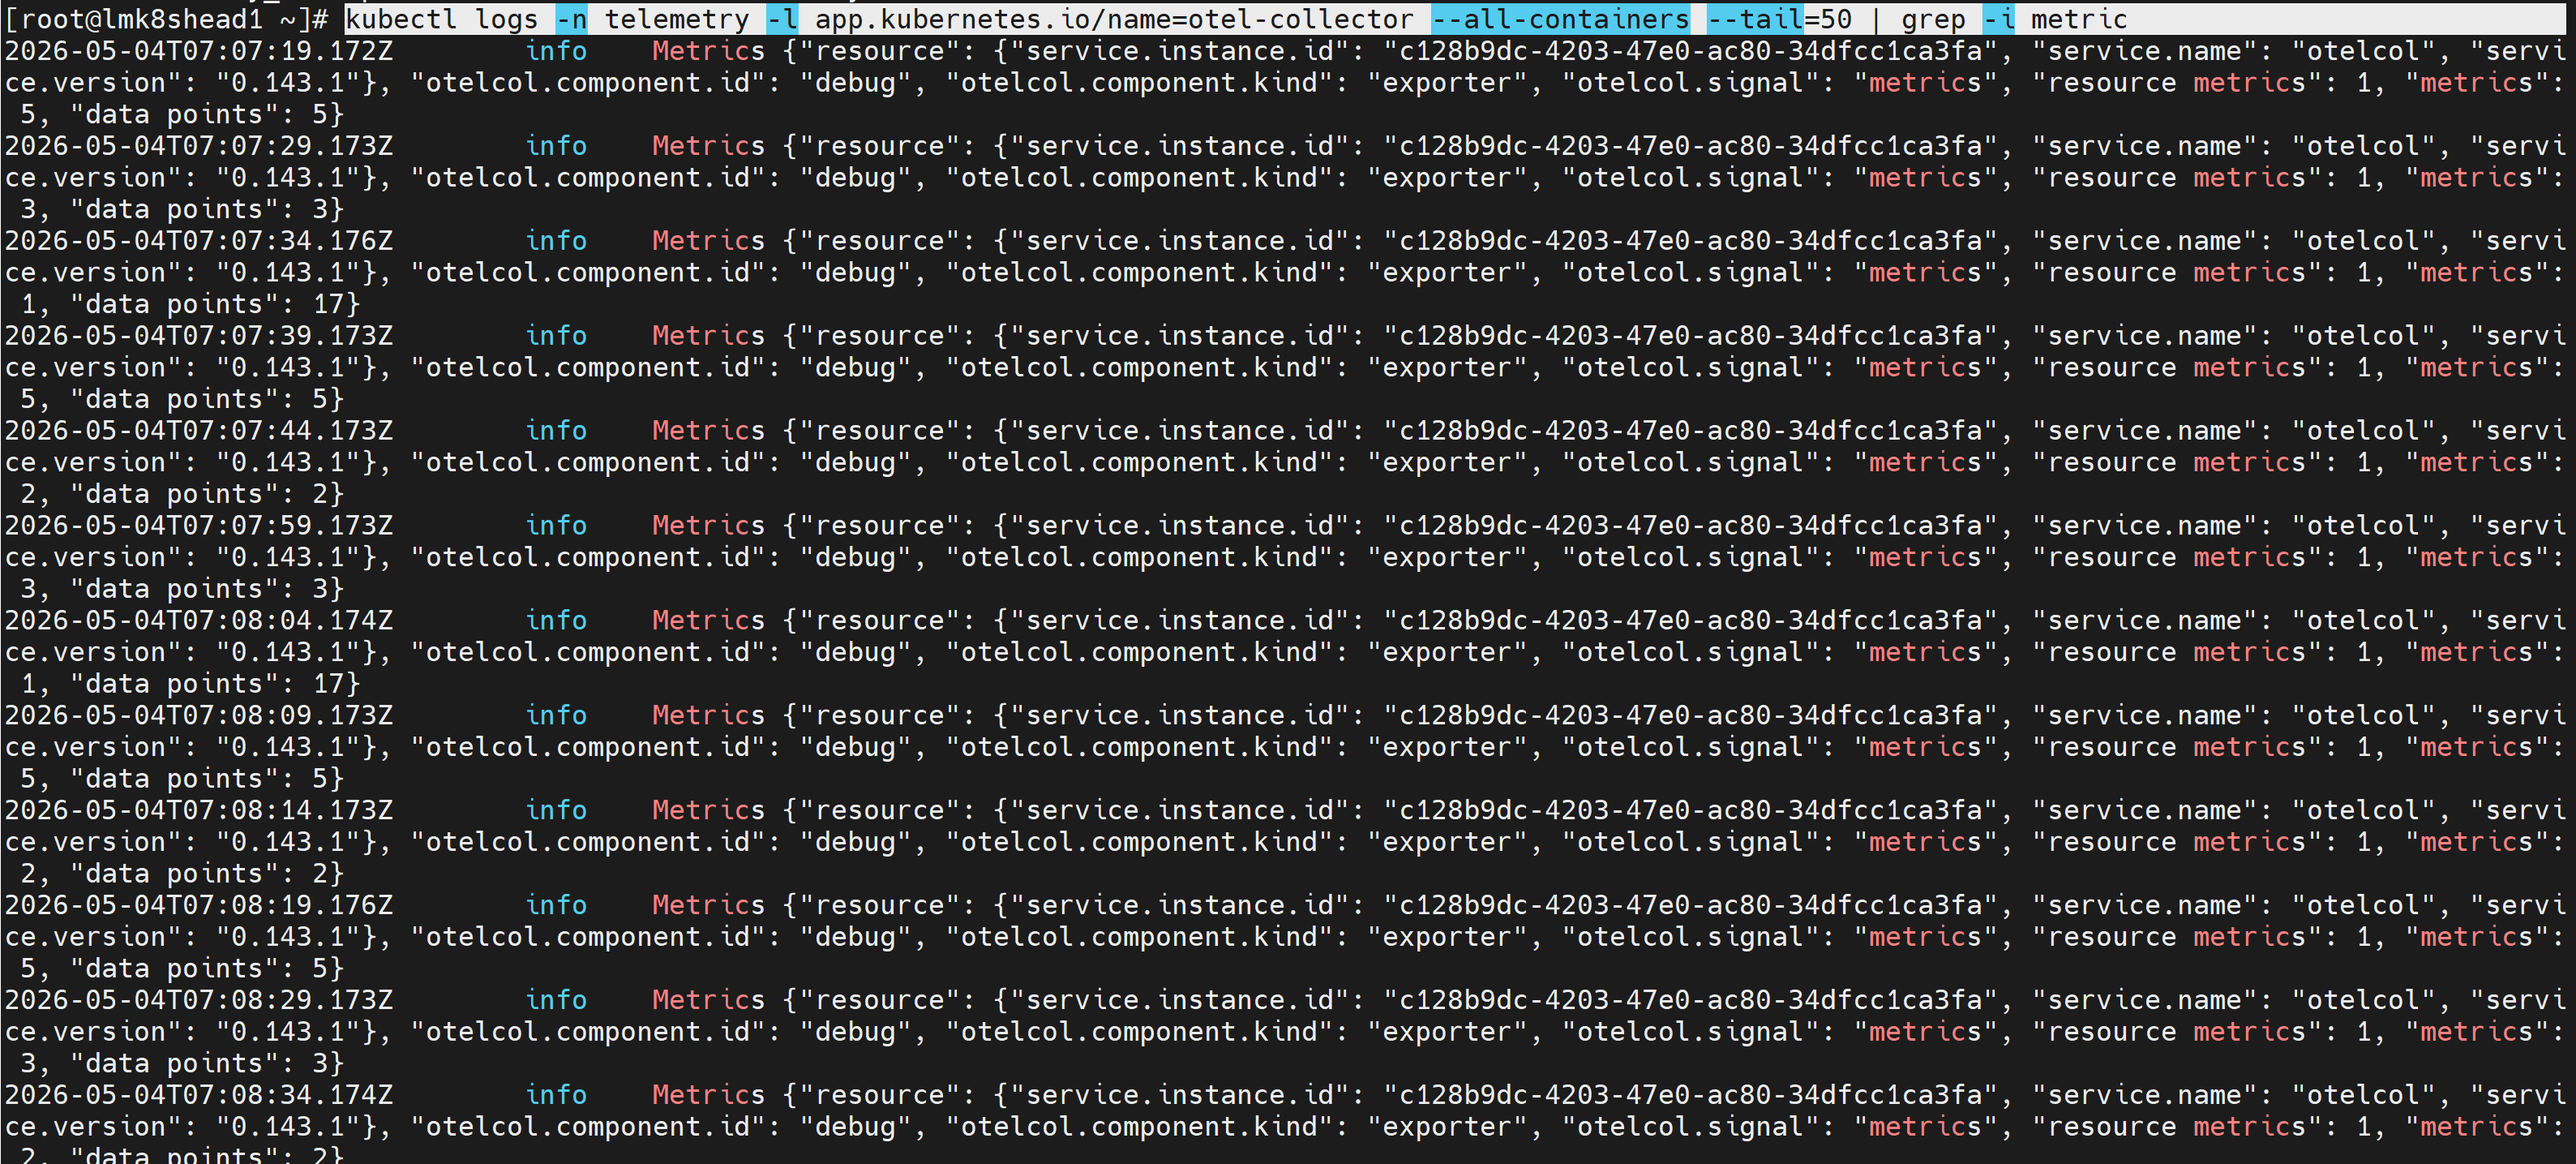
-
Note the External IP and port number of the VictoriaMetrics service.
-
Access the VMUI:
VMUI URLhttps://<external vmselect loadbalancer IP>:8481/select/0/vmui -
Filter and view telemetry metrics. For example:
Example PromQL query{source=~"powerscale"}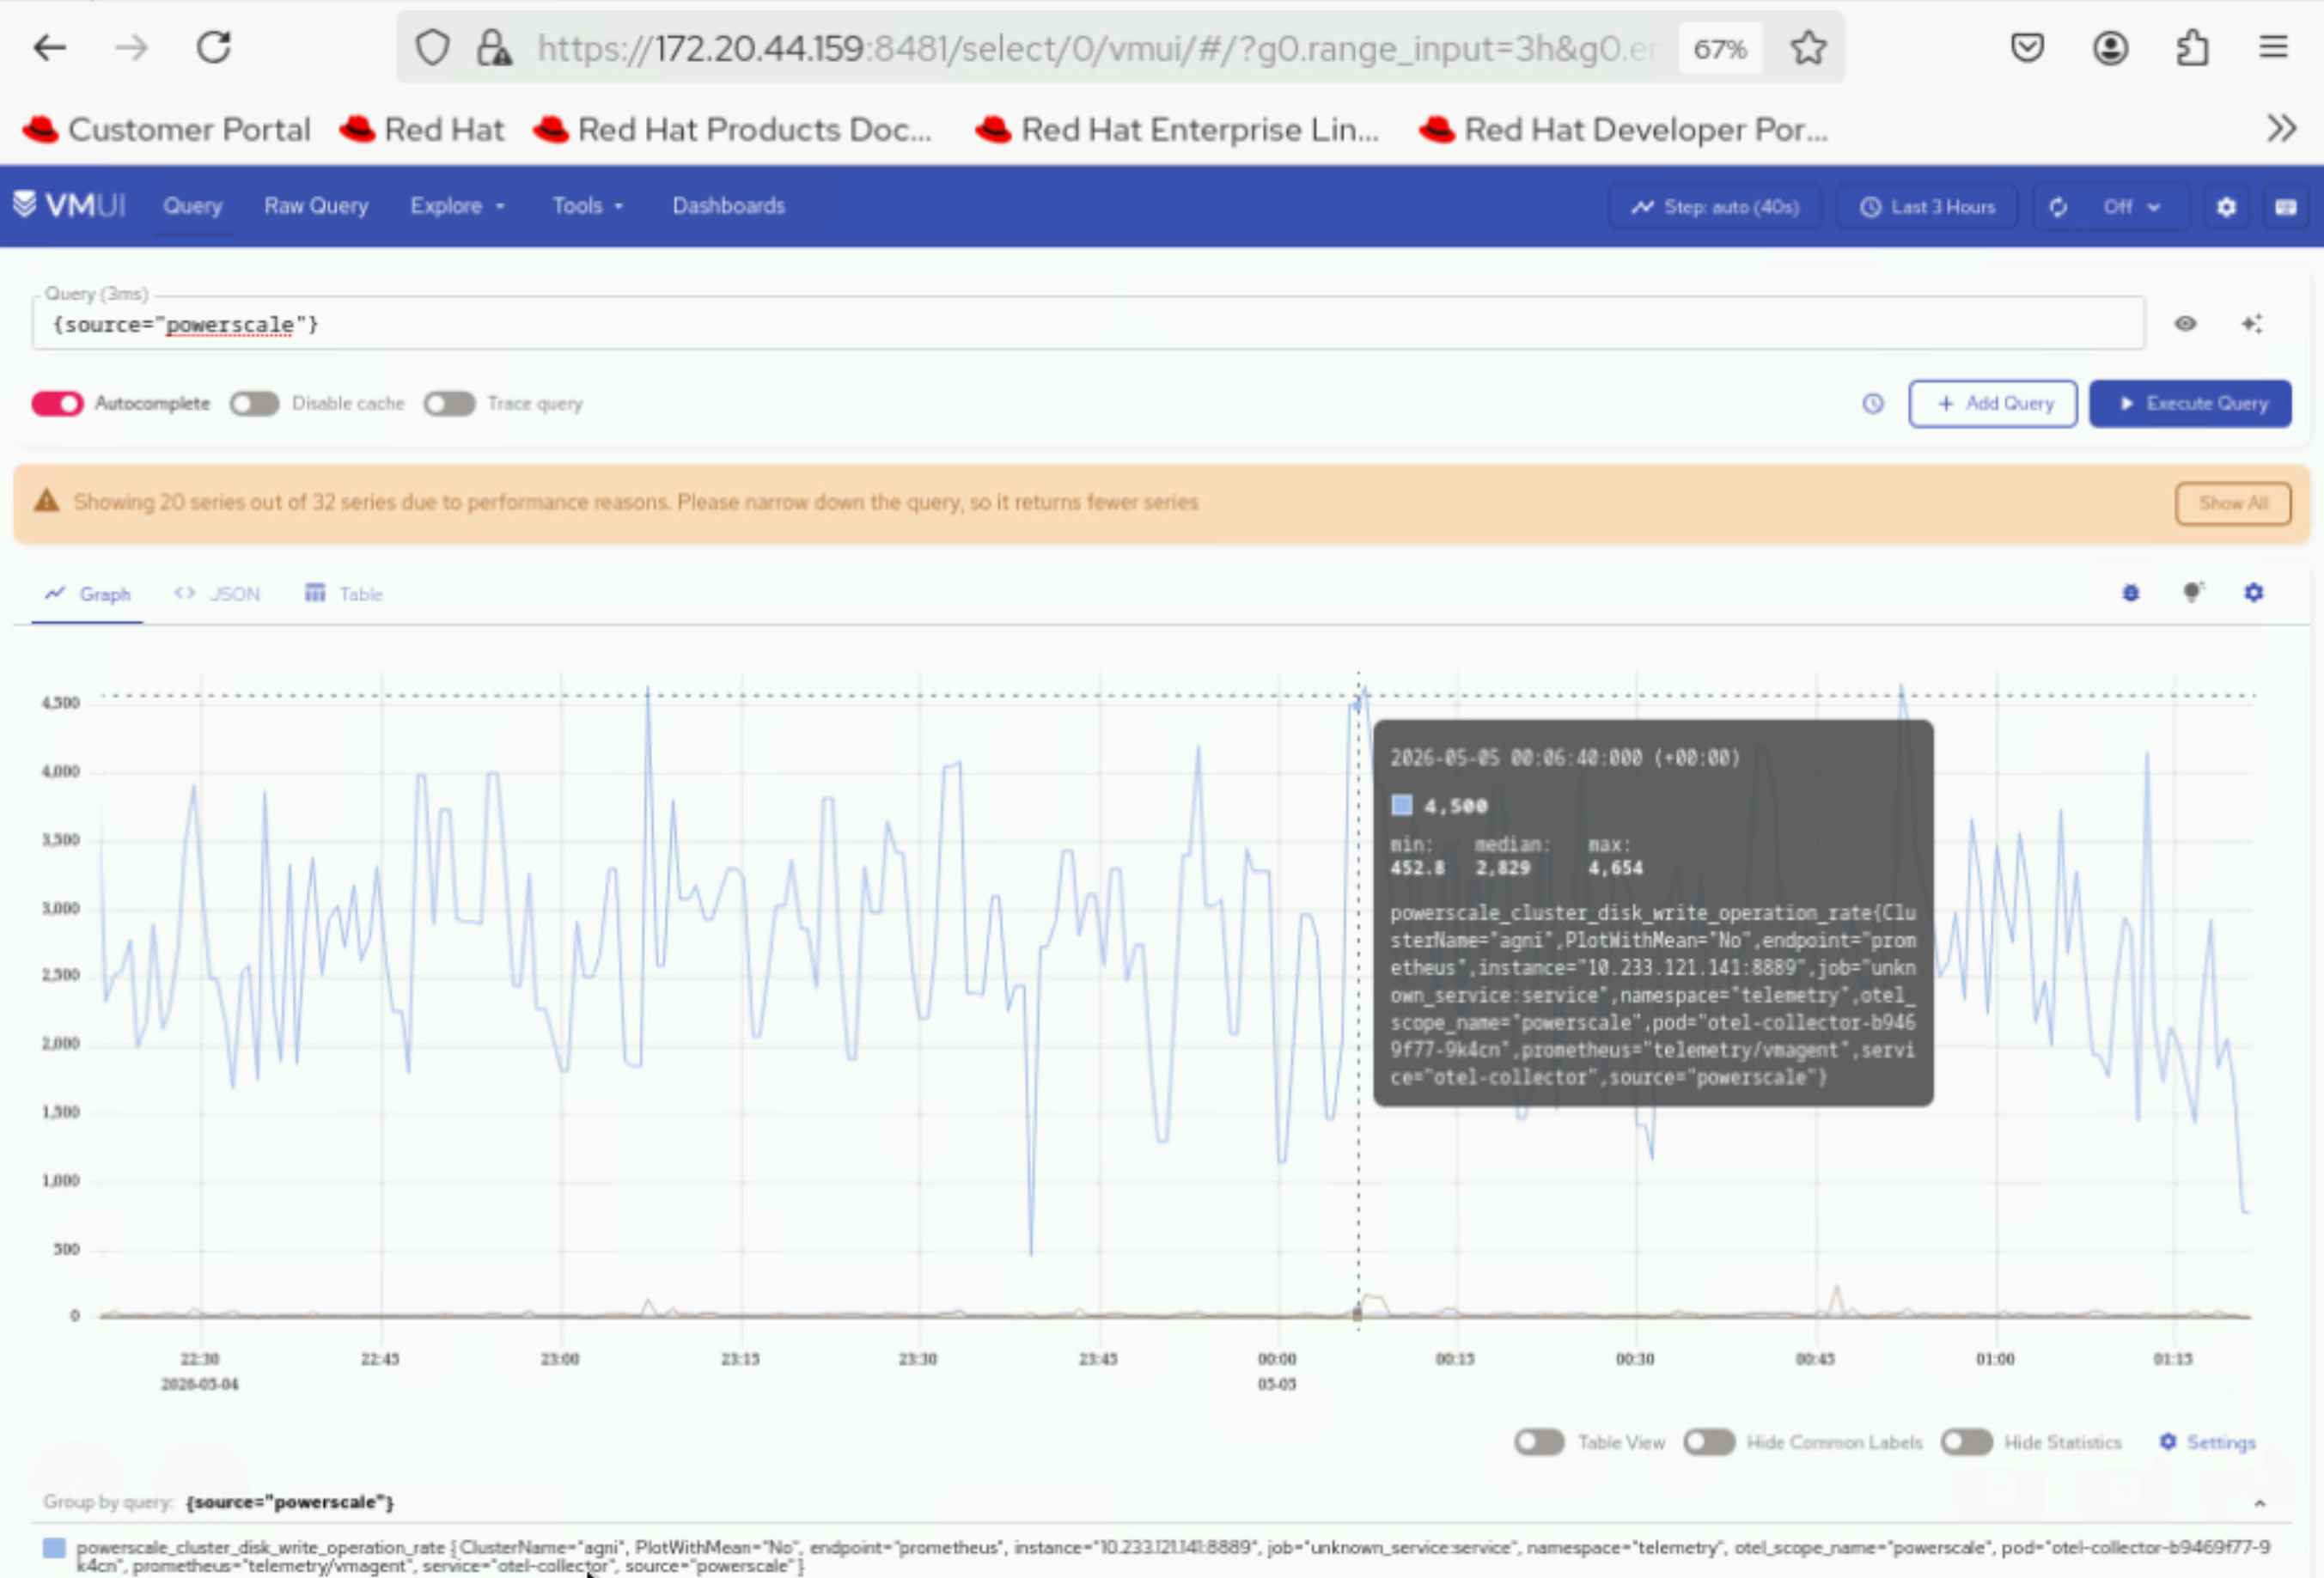
Access the MySQL Database
After telemetry.yml has been executed, you can check the MySQL database inside the mysqldb container:
-
Get the names of all telemetry pods:
Run on: Service Kubernetes Control planekubectl get pods -n telemetry -l app=idrac-telemetryNote
The
idrac-telemetry-0pod is always responsible for collecting telemetry data of the management nodes (oim,service_kube_control_plane_x86_64,service_kube_node_x86_64,login_node_x86_64, etc.). -
Execute the following command:
Run on: Service Kubernetes Control planekubectl exec -it -n telemetry <iDRAC_telemetry_pod_name> -c mysqldb -- mysql -u <MYSQL_USER> -p -
When prompted, enter the MySQL password to log in.
-
Enter the
idrac_telemetry_db:Run on: Service Kubernetes Control planeuse idrac_telemetrydb; -
Access the services table:
Run on: Service Kubernetes Control planeselect * from services;
Next Steps
- Execute Build Pipeline -- Update catalog and trigger the build pipeline
- Execute Deploy Pipeline -- Deploy built images to cluster nodes
Troubleshooting
- Telemetry pods not running: Verify that the service cluster is deployed and Kubernetes is running. Check pod logs with
kubectl logs -n telemetry <pod-name>. - No Kafka messages: Verify that iDRAC telemetry is enabled and nodes are accessible. Wait 2-3 minutes after discovery before checking.
- For additional issues, see BuildStreaM Troubleshooting.