Configure PowerScale Telemetry
Configure deployment of PowerScale Telemetry to collect storage performance metrics and logs from Dell PowerScale storage nodes.
Overview
PowerScale Telemetry collects storage performance metrics and logs. PowerScale Telemetry includes the following components:
Components
- CSM Metrics for PowerScale -- Queries the OneFS API and emits metrics to an OpenTelemetry Collector.
- OpenTelemetry Collector -- Receives metrics from CSM Metrics and exposes a Prometheus endpoint for scraping.
- vmagent -- Scrapes the OpenTelemetry Collector Prometheus endpoint over TLS and forwards metrics to VictoriaMetrics.
- VLAgent -- Receives PowerScale syslog events and forwards them to VictoriaLogs.
- CSI Driver for Dell PowerScale -- Required for Omnia-orchestrated deployment mode.
- cert-manager -- Required for TLS certificate management in Omnia-orchestrated mode.
Data Flow
PowerScale Nodes → CSM Metrics PowerScale → OTEL Collector → vmagent (shared) → VictoriaMetrics
PowerScale Nodes → syslog → VLAgent → VictoriaLogs
Supported Metrics and Logs
Metrics:
| Category | Metrics Collected |
|---|---|
| Performance | Protocol-level IOPS (NFS, SMB, S3), throughput (bytes/s), read/write latency |
| Capacity | Total cluster capacity, used capacity, available capacity, per-node capacity |
| Health | Node online/offline status, disk health, cluster rebalance status, protection group status |
| Topology | Cluster node membership, node roles, interconnect layout, protection domain mapping |
For the complete list of PowerScale telemetry metrics, see PowerScale Metrics Reference and Supported PowerScale Metrics.
Logs:
| Category | Logs Collected |
|---|---|
| System Events | Capacity warnings, disk failures, node state changes, protocol errors |
| Labels | Events are labeled with host/cluster, severity, and facility |
Health Monitor Metrics
When the CSI PowerScale health monitor is enabled (controller > healthMonitor > enabled: true and node > healthMonitor > enabled: true in the CSI PowerScale values.yaml), Omnia collects the following additional health metrics:
PV Metrics:
powerscale_volume_status- PV phase (1=Bound, 0=Other) [pv_name, phase]powerscale_volume_count- Total PowerScale PVs by phase [phase]powerscale_volume_capacity_bytes- PV capacity in bytes [pv_name]powerscale_volume_info- PV metadata [pv_name, phase, storage_class, reclaim_policy, access_modes, volume_handle, pvc_name, pvc_namespace]powerscale_volume_age_seconds- Seconds since PV creation [pv_name]
PVC Metrics:
powerscale_pvc_status_phase- PVC phase (1=Bound, 0=Other) [pvc_name, pvc_namespace, phase]powerscale_pvc_requested_bytes- PVC requested storage in bytes [pvc_name, pvc_namespace]powerscale_pvc_count- Total PowerScale PVCs by phase [phase]
Health Event Metrics:
powerscale_volume_health_abnormal- Volume condition abnormal (1=abnormal, 0=healthy) [pvc_name, pvc_namespace, pv_name]powerscale_volume_abnormal_events_total- Total VolumeConditionAbnormal events [pvc_name, pvc_namespace]powerscale_node_failure_events_total- Total node failure events [node]
Node Metrics:
powerscale_node_ready- Node Ready condition (1=True, 0=False) [node]
Storage Class Metrics:
powerscale_storageclass_info- StorageClass metadata [storageclass, provisioner, reclaim_policy, volume_binding_mode, allow_volume_expansion]
Aggregate Summary:
powerscale_total_capacity_bytes- Total capacity of all PowerScale PVs in bytes
TLS and Authentication
All metric scraping between the OpenTelemetry Collector and VictoriaMetrics uses TLS encryption. Authentication uses Kubernetes service-account tokens. Mutual TLS (mTLS) is not required — the connection is encrypted but the PowerScale-side endpoint does not validate client identity via certificate exchange. TLS is enforced for all off-cluster communications.
Prerequisites
Complete the following before you configure PowerScale telemetry. Provisioning the cluster happens after this configuration, as part of the deployment sequence.
- The
omnia_corecontainer is deployed on the OIM. See Deploy Omnia Core. - The mapping file (
pxe_mapping_file.csv) is created. See Create Mapping File. - A Dell PowerScale (OneFS) cluster is reachable from the service Kubernetes cluster.
- The CSM Observability (Karavi) values.yaml file is available.
- Network connectivity between the PowerScale cluster and the Omnia log agent for syslog integration.
Procedure
Step 1: Add Required Software to software_config.json
PowerScale telemetry runs on the service Kubernetes cluster and uses the CSI driver
for Dell PowerScale. Add the service_k8s and csi_driver_powerscale entries to
software_config.json. Include an aarch64 entry only if you have aarch64 nodes.
{
    "softwares": [
        {"name": "service_k8s", "version": "1.35.1", "arch": ["x86_64"]},
        {"name": "csi_driver_powerscale", "version": "v2.17.0", "arch": ["x86_64"]}
    ]
}
Note
These entries must be present when telemetry_sources > powerscale > metrics_enabled is set to true in the telemetry_config.yml file. For the full file structure, see the software_config.json reference.
Step 2: Add Required Nodes to the Mapping File
PowerScale telemetry requires a service Kubernetes cluster. In
pxe_mapping_file.csv, ensure the following functional groups are present:
service_kube_control_plane(three control plane nodes)service_kube_node(at least one worker node)
FUNCTIONAL_GROUP_NAME,GROUP_NAME,SERVICE_TAG,PARENT_SERVICE_TAG,HOSTNAME,ADMIN_MAC,ADMIN_IP,BMC_MAC,BMC_IP,IB_NIC_NAME,IB_IP
service_kube_control_plane_x86_64,grp4,H94M8F3,,kcp1,BC:97:E1:F0:94:F0,172.16.107.96,b0:7b:25:d8:4a:f4,100.10.1.99,,
service_kube_control_plane_x86_64,grp5,2LXT933,,kcp2,BC:97:E1:F0:95:10,172.16.107.97,b0:7b:25:d8:4b:04,100.10.1.100,,
service_kube_control_plane_x86_64,grp7,8X697C3,,kcp3,BC:97:E1:F0:95:30,172.16.107.98,b0:7b:25:d8:4b:14,100.10.1.101,,
service_kube_node_x86_64,grp6,GZF6ZS3,,kn,EC:2A:72:32:C6:98,172.16.107.95,ec:2a:72:3b:a8:52,100.10.0.209,,
For the full format, see the PXE mapping file reference.
Step 3: Enable PowerScale in telemetry_config.yml
Configure PowerScale telemetry settings in telemetry_config.yml. For details on all parameters, see the telemetry_config.yml reference.
telemetry_sources:
  powerscale:
    metrics_enabled: true
    logs_enabled: true
    collection_targets:
      - "victoria_metrics"
      - "victoria_logs"

powerscale_configurations:
  otel_collector_storage_size: "5Gi"
  csm_observability_values_file_path: ""
| Parameter | Description |
|---|---|
metrics_enabled |
Enable or disable PowerScale metric collection (true or false) |
logs_enabled |
Enable or disable PowerScale log collection (true or false) |
collection_targets |
Where PowerScale data is sent. Supported: victoria_metrics, victoria_logs |
otel_collector_storage_size |
Persistent storage size for the OpenTelemetry Collector |
csm_observability_values_file_path |
Path to the CSM Observability (Karavi) values.yaml file |
Note
PowerScale Telemetry supports independent feature flags for metric collection and log collection. You can enable or disable each independently.
Step 4: Configure the CSM Observability Values File
- Provide the path to the CSM Observability (Karavi Observability) values.yaml file in
telemetry_config.yml. - Reference: karavi-observability values.yaml
- Important: In the values.yaml file, only set
karaviMetricsPowerscale > enabled: true. Set the following parameters tofalse:karaviMetricsPowerflex > enabled,karaviMetricsPowerstore > enabled,karaviMetricsPowerscale.authorization > enabled,karaviMetricsPowermax > enabled. - Health Metrics: For CSI PowerScale health metrics, enable
controller > healthMonitor > enabled: trueandnode > healthMonitor > enabled: truein the CSI PowerScale values.yaml.
Note
The karavi-metrics-powerscale pod may go into CrashLoopBackOff state when CSM is enabled with Basic authentication. To check the current authentication type on PowerScale:
isi http settings view
If Basic authentication is enabled, update the isiAuthType in the CSM Observability values.yaml file to use session-based authentication.
Step 5: Configure PowerScale Log Forwarding (Optional)
To collect PowerScale logs, configure syslog forwarding on the PowerScale cluster:
-
Enable syslog forwarding from PowerScale:
Run on PowerScale CLIisi audit setting modify --syslog-forwarding-enabled true
-
Enable for required zones:
Run on PowerScale CLIisi audit settings global modify --add-audited-zones=<comma separated zone names> -
Configure the VLAgent LoadBalancer IP address for log delivery:
Run on PowerScale CLIisi audit settings global modify --config-syslog-enabled=1 --config-syslog-servers=<vlagent loadbalancer ip>:514 --config-syslog-tls-enabled=0 isi audit settings global modify --protocol-syslog-servers=<vlagent loadbalancer ip>:514 --protocol-syslog-tls-enabled=0 isi audit settings global modify --system-syslog-enabled=1 --system-syslog-servers=<vlagent loadbalancer ip>:514 --system-syslog-tls-enabled=0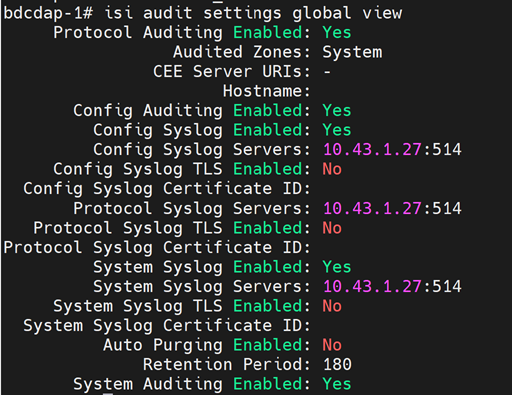
Step 6: Deploy the Cluster
Deploy the cluster by running the full playbook sequence
(prepare_oim.yml -> local_repo.yml -> build_image -> provision.yml).
provision.yml deploys the PowerScale telemetry stack (CSM Metrics, OTEL
Collector, CSI driver) to the service K8s cluster. See
Deploy the Telemetry Stack.
(Optional) Configure dual-destination delivery: Specify the external VictoriaMetrics endpoint in telemetry_config.yml. Metrics will be delivered to both the internal time-series database and the external endpoint independently.
Important
If you enable PowerScale telemetry on an already-provisioned cluster, re-run provision.yml and then execute the telemetry.sh script on the K8s control plane. See Update Telemetry on a Running Cluster.
<K8s_NFS_mount_point>/telemetry/telemetry.sh
Enable and Disable PowerScale Telemetry
To disable PowerScale telemetry:
ansible-playbook telemetry/telemetry_disable.yml --tags powerscale
To enable PowerScale telemetry again after disabling:
ansible-playbook telemetry/telemetry_enable.yml --tags powerscale
Note
- Set
powerscale.metrics_enabledtotrueorfalsein thetelemetry_config.ymlfile. - The
powerscaletag is mandatory to perform the action.
To disable PowerScale logs:
isi audit settings global modify --config-syslog-enabled=0 --clear-config-syslog-servers
isi audit settings global modify --system-syslog-enabled=0 --clear-system-syslog-servers
isi audit settings global modify --clear-protocol-syslog-servers
isi audit setting modify --syslog-forwarding-enabled false
To enable PowerScale logs again after disabling:
isi audit setting modify --syslog-forwarding-enabled true
isi audit settings global modify --config-syslog-enabled=1 --config-syslog-servers=<vlagent loadbalancer ip>:514 --config-syslog-tls-enabled=0
isi audit settings global modify --protocol-syslog-servers=<vlagent loadbalancer ip>:514 --protocol-syslog-tls-enabled=0
isi audit settings global modify --system-syslog-enabled=1 --system-syslog-servers=<vlagent loadbalancer ip>:514 --system-syslog-tls-enabled=0
Verification
Verify PowerScale Telemetry Pods
-
Verify that the VictoriaMetrics pods are running:
Run on K8s control planekubectl get pods -n telemetry -o wide | grep vm
-
Verify that the VictoriaMetrics service is running:
Run on K8s control planekubectl get service -n telemetry -o wide | grep vm
View PowerScale Metrics in VictoriaMetrics UI (VMUI)
Use the VMUI to validate that PowerScale telemetry data is being collected and stored successfully.
-
Note the External IP and port number of the VictoriaMetrics service.
-
Access the VMUI in a web browser:
https://<external vmselect loadbalancer IP>:8481/select/0/vmui -
Filter and view telemetry metrics using queries in VMUI. For example, the following query displays detailed PowerScale metrics for each hardware component:
{__name__=~"powerscale"}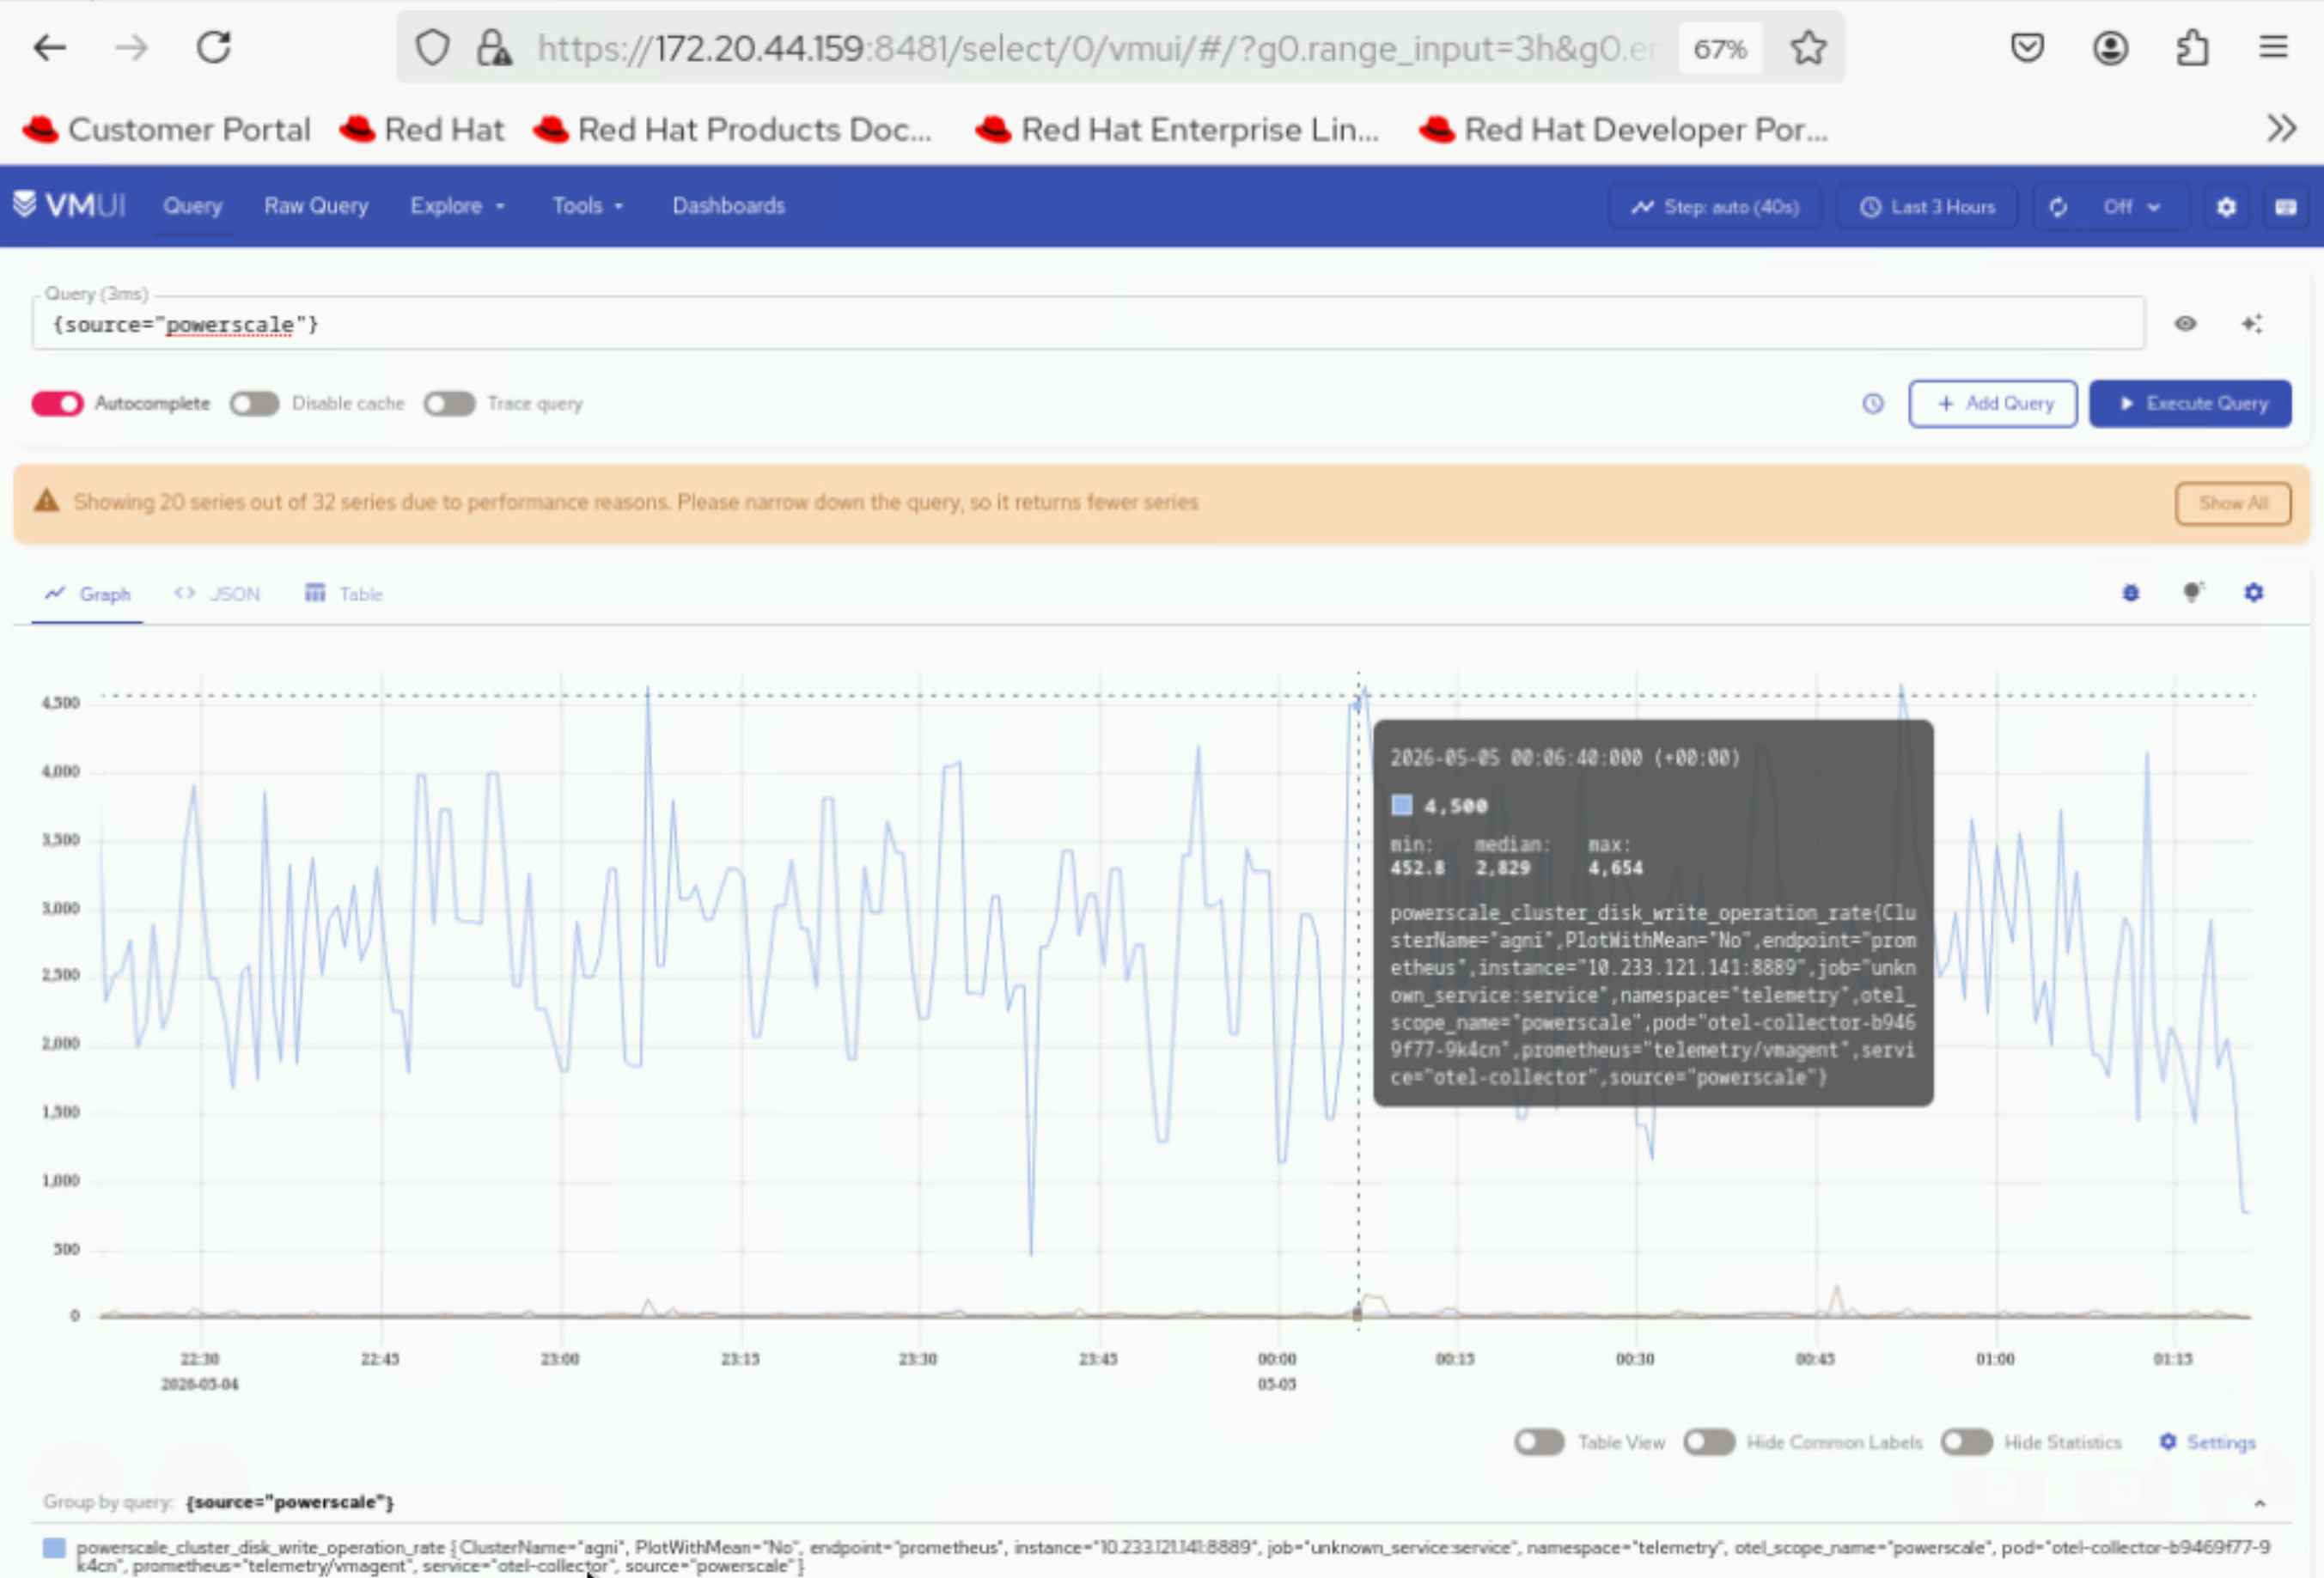
View PowerScale Logs in VictoriaLogs
Use the VictoriaLogs UI to validate that PowerScale log data is being collected.
-
Verify that the VictoriaLogs pods are running:
Run on K8s control planekubectl get pods -n telemetry -o wide | grep vl
-
Verify that the VictoriaLogs service is running:
Run on K8s control planekubectl get service -n telemetry -o wide | grep vl
-
Note the External IP and port number of the VictoriaLogs service.
-
Access the VictoriaLogs UI in a web browser:
https://<external vlselect loadbalancer IP>:9471/select/vmui -
Filter and view PowerScale logs using queries in VictoriaLogs UI. For example, use the
*query to display all logs.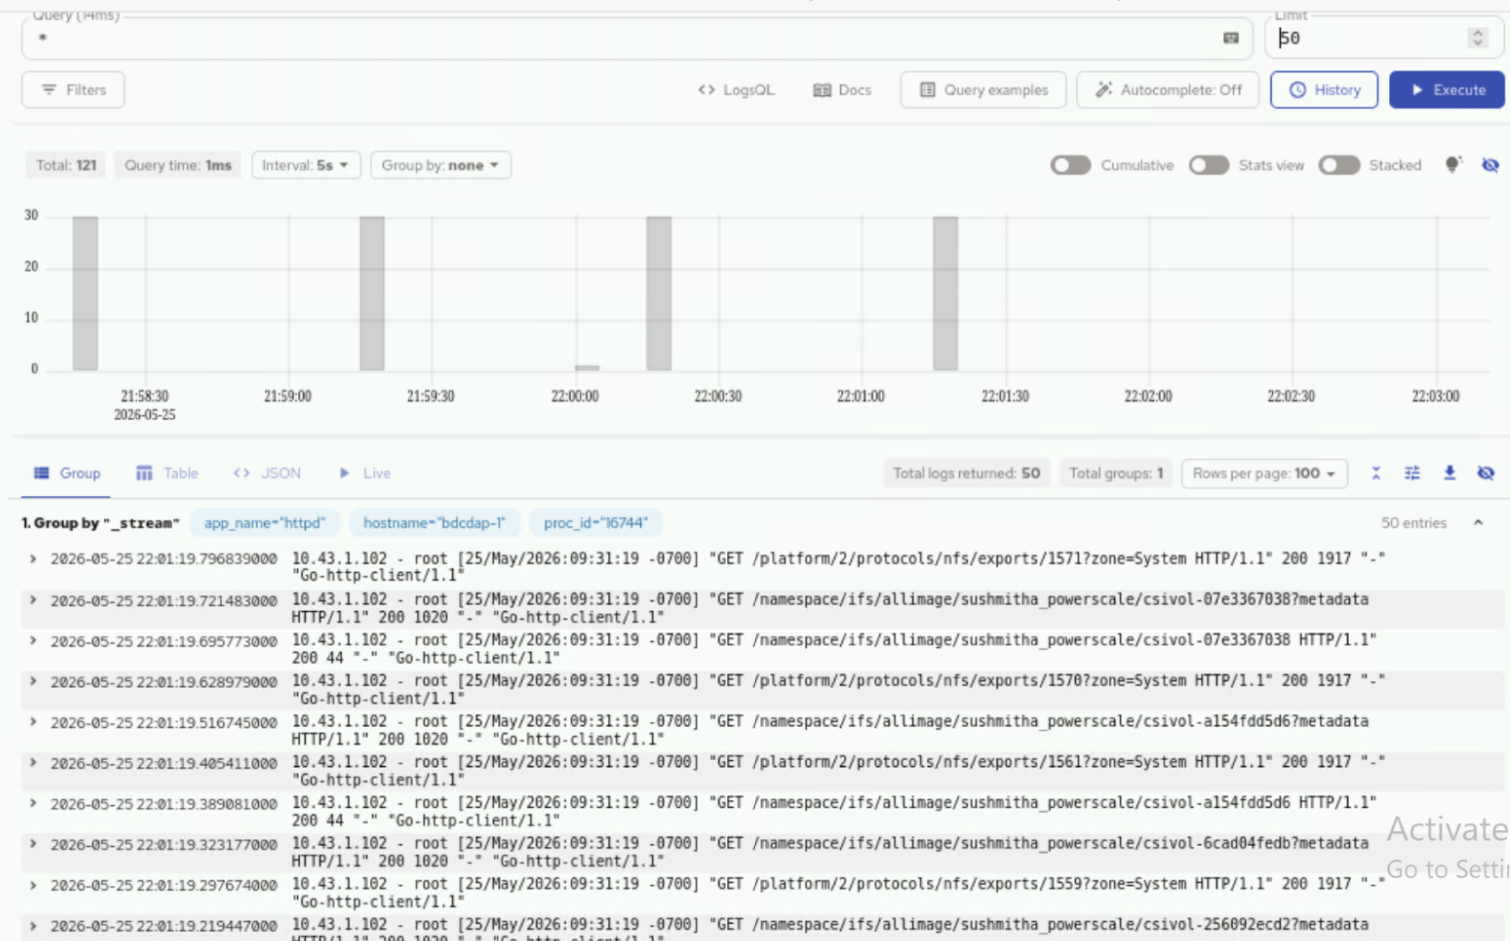
Next Steps
- Setup Telemetry -- Overview of all telemetry sources.
Troubleshooting
For common telemetry issues and resolutions, see Troubleshooting Telemetry.