Configure iDRAC Telemetry
Configure iDRAC Telemetry to collect out-of-band hardware metrics from Dell PowerEdge servers via the Redfish API.
Overview
iDRAC Telemetry collects hardware metrics from Dell servers using the integrated Dell Remote Access Controller (iDRAC). iDRAC Telemetry includes the following components:
Components
- iDRAC Collector -- Polls each server's Redfish endpoint for hardware metrics. Runs as a Kubernetes pod in the telemetry namespace.
- ActiveMQ -- Internal message broker used by the iDRAC collector to decouple metric collection from downstream routing.
- KafkaPump -- Routes iDRAC metrics from ActiveMQ to the Kafka
idractopic. - VictoriaPump -- Routes iDRAC metrics from ActiveMQ to VictoriaMetrics via VMAgent.
- VMAgent -- Forwards metrics to VictoriaMetrics cluster (vminsert).
- MySQL Database -- Stores iDRAC telemetry metadata. Storage size is configurable via
telemetry_storage_config.yml.
Data Flow
iDRAC (BMC) → iDRAC Collector → Kafka
iDRAC (BMC) → iDRAC Collector → VMAgent → VictoriaMetrics
Supported Metrics
| Category | Metrics Collected |
|---|---|
| Thermal | Inlet temperature, exhaust temperature, CPU temperature, fan speeds |
| Power | System power consumption, PSU input/output power, power capping status |
| Storage Health | Physical disk status, virtual disk health, controller health, SMART data |
| CPU/Memory | Correctable/uncorrectable ECC errors, CPU utilization, DIMM health |
| System Events | Hardware alerts, lifecycle events, firmware status |
For the complete list of iDRAC telemetry metrics, see iDRAC Metrics Reference and iDRAC Telemetry Reference Tools.
Prerequisites
Complete the following before you configure iDRAC telemetry. Provisioning the cluster happens after this configuration, as part of the deployment sequence.
- The
omnia_corecontainer is deployed on the OIM. See Deploy Omnia Core. - The mapping file (
pxe_mapping_file.csv) is created. See Create Mapping File. - Redfish must be enabled in iDRAC.
- iDRAC firmware must be updated to the latest version.
- Datacenter license must be installed on the nodes. Enterprise license is not sufficient for streaming telemetry.
- The correct node service tags are displayed on the iDRAC interface. Otherwise, telemetry data cannot be collected by the iDRAC collector.
- All BMC (iDRAC) IPs must be reachable from the service cluster nodes. If the service cluster does not have direct access to the BMC network, configure routing from OIM.
Note
If there is a dedicated setup and BMC IPs are not reachable, enable masquerading (after the cluster is provisioned) to make BMC IPs reachable:
iptables -t nat -A POSTROUTING -o "<external interface which has internet>" -j MASQUERADE
iptables -A FORWARD -i "<local interface which has internet>" -o "<external interface which has internet>" -j ACCEPT
iptables -A FORWARD -i "<external interface which has internet>" -o "<local interface which has internet>" -m state --state RELATED,ESTABLISHED -j ACCEPT
These commands set up Network Address Translation (NAT) and packet forwarding to allow devices on one network interface to access the internet through another interface.
Procedure
Step 1: Add Required Software to software_config.json
iDRAC telemetry runs on the service Kubernetes cluster. Ensure the service_k8s
entry is present in software_config.json. Include an aarch64 entry only if you
have aarch64 nodes.
{
    "softwares": [
        {"name": "service_k8s", "version": "1.35.1", "arch": ["x86_64"]}
    ]
}
For the full file structure, see the software_config.json reference.
Step 2: Add Required Nodes to the Mapping File
iDRAC telemetry requires a service Kubernetes cluster. In pxe_mapping_file.csv,
ensure the following functional groups are present:
service_kube_control_plane(three control plane nodes)service_kube_node(at least one worker node)
The BMC_IP column must be populated for every node whose iDRAC telemetry you want
to collect. Ensure the service tag of the service_kube_node is set as the
PARENT_SERVICE_TAG for the Slurm nodes.
FUNCTIONAL_GROUP_NAME,GROUP_NAME,SERVICE_TAG,PARENT_SERVICE_TAG,HOSTNAME,ADMIN_MAC,ADMIN_IP,BMC_MAC,BMC_IP,IB_NIC_NAME,IB_IP
service_kube_control_plane_x86_64,grp4,H94M8F3,,kcp1,BC:97:E1:F0:94:F0,172.16.107.96,b0:7b:25:d8:4a:f4,100.10.1.99,,
service_kube_control_plane_x86_64,grp5,2LXT933,,kcp2,BC:97:E1:F0:95:10,172.16.107.97,b0:7b:25:d8:4b:04,100.10.1.100,,
service_kube_control_plane_x86_64,grp7,8X697C3,,kcp3,BC:97:E1:F0:95:30,172.16.107.98,b0:7b:25:d8:4b:14,100.10.1.101,,
service_kube_node_x86_64,grp6,GZF6ZS3,,kn,EC:2A:72:32:C6:98,172.16.107.95,ec:2a:72:3b:a8:52,100.10.0.209,,
For the full format, see the PXE mapping file reference.
Step 3: Enable iDRAC in telemetry_config.yml
Configure iDRAC telemetry settings in telemetry_config.yml. For details on all parameters, see the telemetry_config.yml reference.
telemetry_sources:
  idrac:
    metrics_enabled: true
    collection_targets:
      - "victoria_metrics"
      - "kafka"

idrac_telemetry_configurations:
  mysqldb_storage: "1Gi"
| Parameter | Description |
|---|---|
metrics_enabled |
Enable or disable iDRAC metrics collection (true or false) |
collection_targets |
Where iDRAC data is sent. Supported: victoria_metrics, kafka. You can specify both |
mysqldb_storage |
Storage size for the iDRAC telemetry MySQL metadata database |
Step 4: Deploy the Cluster
Deploy the cluster by running the full playbook sequence
(prepare_oim.yml -> local_repo.yml -> build_image -> provision.yml).
provision.yml deploys the iDRAC telemetry infrastructure to the service K8s
cluster. See Deploy the Telemetry Stack.
iDRAC telemetry requires one additional step after provisioning. Run
telemetry.yml to validate the BMC IPs and initiate iDRAC telemetry collection:
cd /omnia/telemetry
ansible-playbook telemetry.yml
Note
telemetry.ymlvalidates iDRAC BMC IPs, generates the service cluster metadata, and triggers the iDRAC telemetry collection.- Service cluster metadata automatically captures the service cluster kube control plane virtual IP. As a result,
telemetry.ymlis executed against the VIP rather than an individual control plane node.
Important
If you enable iDRAC telemetry on an already-provisioned cluster, re-run provision.yml, execute the telemetry.sh script on the K8s control plane, and then run telemetry.yml. See Update Telemetry on a Running Cluster.
<K8s_NFS_mount_point>/telemetry/telemetry.sh
Step 5: Collect Telemetry from External Nodes (Optional)
To collect iDRAC telemetry from servers that are not part of the Omnia-managed cluster:
-
Update the BMC IP of the external nodes in
/opt/omnia/telemetry/bmc_group_data.csv. TheGROUP_NAMEandPARENTfields must be left blank.Sample bmc_group_data.csv2. Run the telemetry playbook:BMC_IP,GROUP_NAME,PARENT 10.3.0.101,, 10.3.0.102,,Run on omnia_core containercd /omnia/telemetry ansible-playbook telemetry.yml
Verification
Verify iDRAC Telemetry Pods
-
Verify that the iDRAC telemetry pod is running:
Run on K8s control planekubectl get pods -n telemetry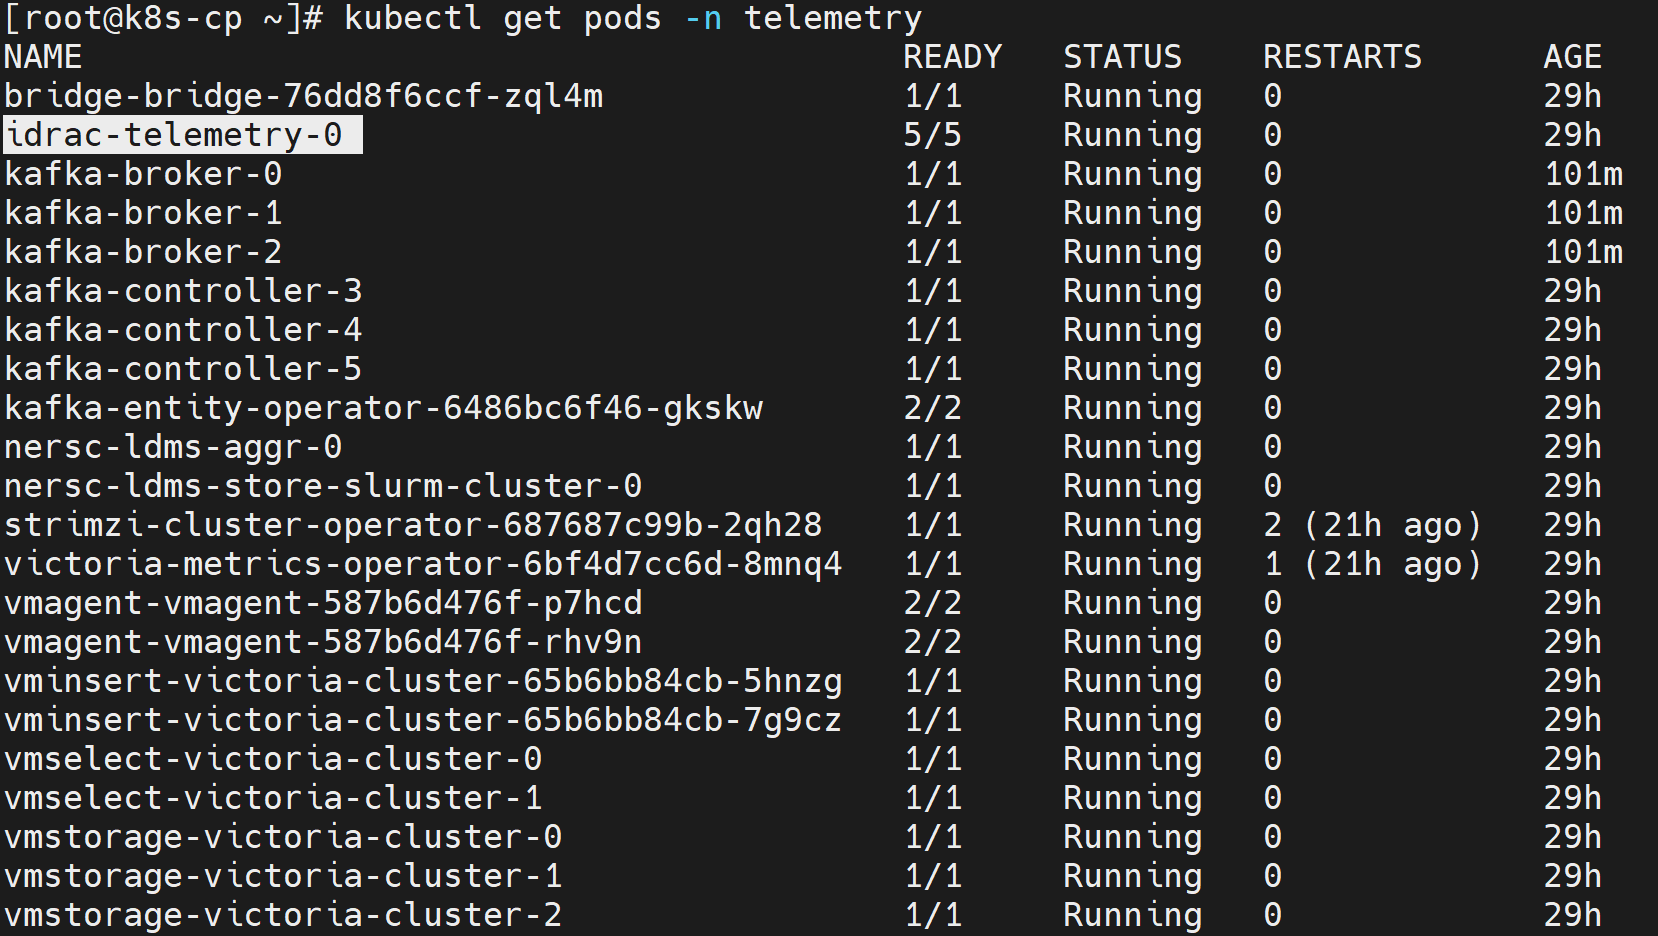
Note
The idrac-telemetry-0 pod is a StatefulSet that collects telemetry data from all management nodes (oim, service_kube_control_plane_x86_64, service_kube_node_x86_64, login_node_x86_64, etc.). The number of idrac-telemetry pod replicas is determined by the number of unique PARENT_SERVICE_TAG values in the mapping file. Each replica collects telemetry from the iDRAC interfaces of the nodes that share the same parent service tag.
Verify iDRAC Messages in Kafka
To verify that iDRAC telemetry data is being successfully published to the idrac Kafka topic:
-
Log in to the Service Kubernetes control plane.
-
List the telemetry services to identify the
bridge-bridge-lbexternal IP:Run on K8s control planekubectl get svc -n telemetry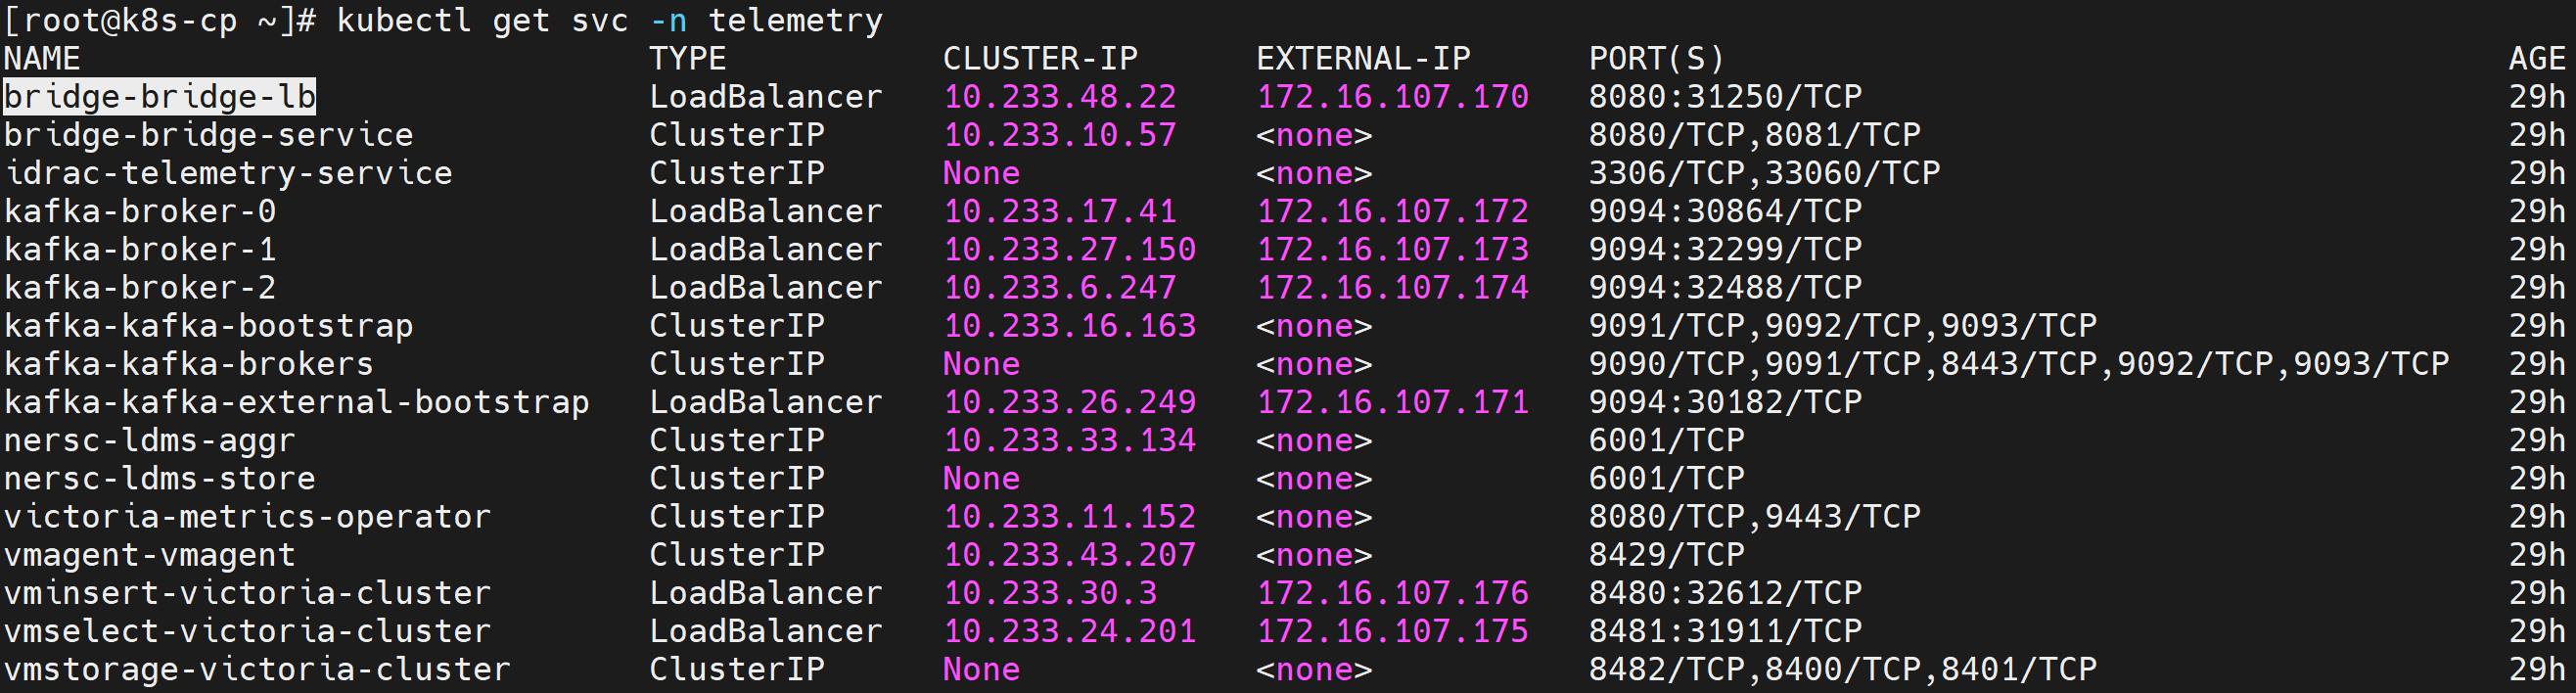
-
Set the required variables:
Run on K8s control planeKAFKA_LB_IP=<external IP of bridge-bridge-lb service> TOPIC=idrac GROUP=idrac-consumer-group INSTANCE=idrac-consumer-1 -
Create a Kafka consumer:
Run on K8s control planecurl -X POST http://$KAFKA_LB_IP:8080/consumers/idrac-consumer-group \ -H 'content-type: application/vnd.kafka.v2+json' \ -d '{ "name": "idrac-consumer-1", "format": "json", "auto.offset.reset": "earliest" }' -
View the list of iDRAC Kafka topics configured:
Run on K8s control planecurl -s -X GET "http://$KAFKA_LB_IP:8080/topics" | jq '.' -
Subscribe the consumer to the telemetry topic:
Run on K8s control planecurl -X POST http://$KAFKA_LB_IP:8080/consumers/idrac-consumer-group/instances/idrac-consumer-1/subscription \ -H 'content-type: application/vnd.kafka.v2+json' \ -d '{"topics": ["idrac"]}' -
Consume messages from the topic:
Run on K8s control planewhile true; do curl -X GET http://$KAFKA_LB_IP:8080/consumers/idrac-consumer-group/instances/idrac-consumer-1/records \ -H 'accept: application/vnd.kafka.json.v2+json' | jq '.' ; sleep 2; done
If telemetry metrics are collected correctly, the output contains JSON-formatted iDRAC telemetry records.
Verify TLS Connectivity
VictoriaMetrics TLS
-
Run the VictoriaMetrics TLS test job:
Run on K8s control planecd /<nfs client mount path of the service k8s cluster>/telemetry/deployments/test kubectl apply -f victoria-tls-test-job.yaml -
After the job completes, check the logs to confirm that the TLS connection is successful:
Run on K8s control planekubectl logs victoria-tls-test-xxx -n telemetry
Kafka TLS
-
Run the Kafka TLS test job:
Run on K8s control planecd /<nfs client mount path of the service k8s cluster>/telemetry/deployments/test kubectl apply -f kafka.tls_test_job.yaml -
After the job completes, check the logs to confirm that the TLS connection is successful:
Run on K8s control planekubectl logs kafka-tls-test-xxx -n telemetry
View iDRAC Metrics in VictoriaMetrics UI (VMUI)
Use the VMUI to validate that iDRAC telemetry data is being collected and stored successfully.
-
Verify that the VictoriaMetrics pods are running:
Run on K8s control planekubectl get pods -n telemetry -o wide | grep vm
-
Verify that the VictoriaMetrics service is running:
Run on K8s control planekubectl get service -n telemetry | grep vm
-
Note the External IP and port number of the VictoriaMetrics service.
-
Access the VMUI in a web browser:
https://<external vmselect loadbalancer IP>:8481/select/0/vmui -
Filter and view telemetry metrics using queries in VMUI. For example, the following
PowerEdge_TemperatureReadingquery displays all available metrics: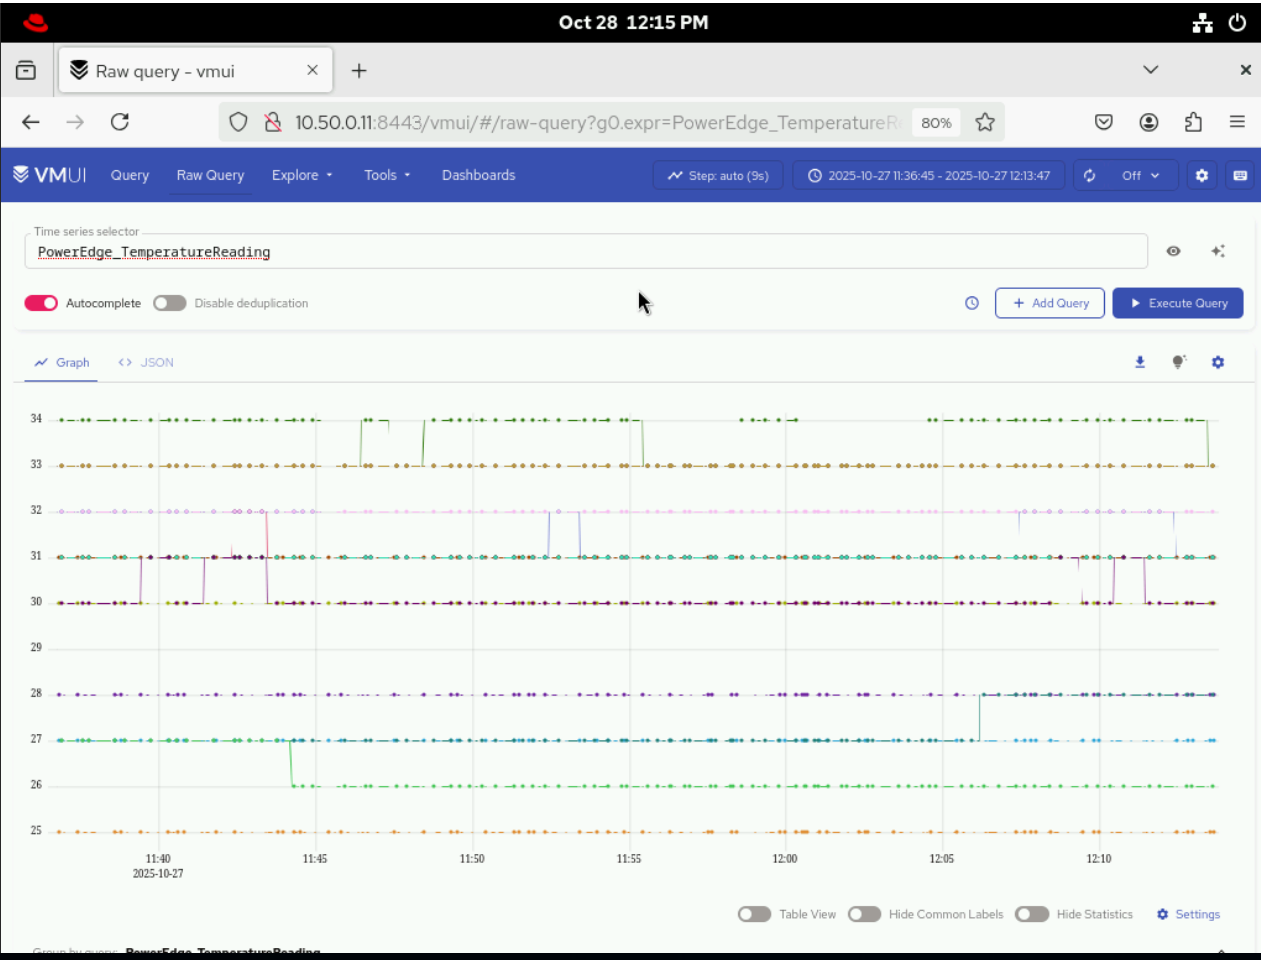
Access the MySQL Database
After telemetry.yml has been executed for the service cluster, you can check the MySQL database inside the mysqldb container.
-
Get the names of all the telemetry pods:
Run on K8s control planekubectl get pods -n telemetry -l app=idrac-telemetryNote
The
idrac-telemetry-0pod will always be responsible for collecting the telemetry data of the management nodes (oim,service_kube_control_plane_x86_64,service_kube_node_x86_64,login_node_x86_64, etc.). -
Execute the following command:
Run on K8s control planekubectl exec -it -n telemetry <iDRAC_telemetry_pod_name> -c mysqldb -- mysql -u <MYSQL_USER> -p -
When prompted, enter the MySQL password to log in.
-
To enter into the
idrac_telemetry_db:use idrac_telemetrydb; -
To access the services table:
select * from services;
Next Steps
- Setup Telemetry -- Overview of all telemetry sources.
Troubleshooting
For common telemetry issues and resolutions, see Troubleshooting Telemetry.