Configure VAST Telemetry
Configure VAST Storage to securely stream telemetry metrics and logs to the Service Kubernetes cluster.
Overview
VAST Telemetry collects storage metrics and logs. VAST Telemetry includes the following components:
Components
- VAST Prometheus Exporter -- Exposes storage metrics on a Prometheus-compatible HTTPS endpoint (default port 443).
- vmagent (shared) -- Scrapes the VAST Prometheus exporter endpoint over TLS and forwards metrics to VictoriaMetrics.
- VMServiceScrape CR -- Kubernetes custom resource that declares the VAST scrape target for the VictoriaMetrics operator.
- VLAgent -- Receives VAST syslog events (RFC 3164/5424) and forwards them to VictoriaLogs.
- Kubernetes Service + Endpoints -- Abstracts the external VAST appliance as a discoverable Kubernetes service for vmagent.
Data Flow
VAST Storage Appliances → OTEL Collector → vmagent (shared) → VictoriaMetrics
VAST Storage Appliances → syslog → VLAgent → VictoriaLogs
Supported Metrics and Logs
Metrics:
| Category | Metrics Collected |
|---|---|
| Storage Performance | Read/write throughput (bytes/sec), IOPS per volume, latency metrics |
| Capacity | Total capacity, used capacity, available capacity, thin provisioning ratios |
| Volume | Volume state, volume performance counters, snapshot metrics |
| Device | Device health status, device performance, device error counters |
| Cluster Health | Node status, cluster connectivity, replication status |
| Telemetry Health | Scrape success rate, scrape duration, ingest latency |
For the complete list of VAST telemetry metrics, see VAST Metrics Reference.
Logs:
| Category | Logs Collected |
|---|---|
| Storage Events | Volume creation/deletion events, snapshot events, capacity threshold alerts |
| System Events | Node health events, cluster state changes, replication events |
| Alarm Events | Critical alarms, warning alarms, informational events |
| Labels | Events are labeled with hostname, severity, and facility |
Note
VAST Telemetry supports independent feature flags for metric collection and log collection. You can enable or disable each independently.
Prerequisites
Complete the following before you configure VAST telemetry. Provisioning the cluster happens after this configuration, as part of the deployment sequence.
- The
omnia_corecontainer is deployed on the OIM. See Deploy Omnia Core. - The mapping file (
pxe_mapping_file.csv) is created. See Create Mapping File. - Network connectivity between the service Kubernetes cluster and the VAST Storage appliance.
- A running VAST Data cluster (Omnia does not deploy VAST itself).
Procedure
Step 1: Add Required Software to software_config.json
VAST telemetry runs on the service Kubernetes cluster (Omnia configures the shared
vmagent to scrape the VAST Prometheus endpoint). Ensure the service_k8s entry is
present in software_config.json. Include an aarch64 entry only if you have
aarch64 nodes.
{
    "softwares": [
        {"name": "service_k8s", "version": "1.35.1", "arch": ["x86_64"]}
    ]
}
For the full file structure, see the software_config.json reference.
Step 2: Add Required Nodes to the Mapping File
VAST telemetry requires a service Kubernetes cluster. In pxe_mapping_file.csv,
ensure the following functional groups are present:
service_kube_control_plane(three control plane nodes)service_kube_node(at least one worker node)
FUNCTIONAL_GROUP_NAME,GROUP_NAME,SERVICE_TAG,PARENT_SERVICE_TAG,HOSTNAME,ADMIN_MAC,ADMIN_IP,BMC_MAC,BMC_IP,IB_NIC_NAME,IB_IP
service_kube_control_plane_x86_64,grp4,H94M8F3,,kcp1,BC:97:E1:F0:94:F0,172.16.107.96,b0:7b:25:d8:4a:f4,100.10.1.99,,
service_kube_control_plane_x86_64,grp5,2LXT933,,kcp2,BC:97:E1:F0:95:10,172.16.107.97,b0:7b:25:d8:4b:04,100.10.1.100,,
service_kube_control_plane_x86_64,grp7,8X697C3,,kcp3,BC:97:E1:F0:95:30,172.16.107.98,b0:7b:25:d8:4b:14,100.10.1.101,,
service_kube_node_x86_64,grp6,GZF6ZS3,,kn,EC:2A:72:32:C6:98,172.16.107.95,ec:2a:72:3b:a8:52,100.10.0.209,,
For the full format, see the PXE mapping file reference.
Step 3: Configure the VAST Appliance
Verify that the VAST Prometheus exporter endpoints are accessible:
https://<vast_ip>:443/api/prometheusmetrics/all
https://<vast_ip>:443/api/prometheusmetrics/views
https://<vast_ip>:443/api/prometheusmetrics/devices
https://<vast_ip>:443/api/prometheusmetrics/alarms
(Optional) Configure SSL certificates -- If using CA-signed TLS, set up SSL and CA certificates. For details, see VAST Data Documentation - Security Configuration.
Step 4: Configure VAST Log Forwarding (Optional)
To collect VAST logs, configure syslog forwarding on the VAST appliance. First, retrieve the VLAgent LoadBalancer IP:
kubectl get svc -n telemetry | grep vlagent
- From the left navigation menu, select Settings > Notifications.
- Select Syslog Setup and complete the fields:
- Syslog Host: Enter the VLAgent LoadBalancer IP address
- Syslog Port: Enter 514 (default)
- Syslog Protocol: Select UDP or TCP based on your requirements
- Click Save.
For detailed information on VAST syslog configuration parameters, see VAST Data Documentation - Default Notification Actions.
Step 5: Enable VAST in telemetry_config.yml
Configure the VAST telemetry settings in telemetry_config.yml. For details on all parameters, see the telemetry_config.yml reference.
telemetry_sources:
  vast:
    metrics_enabled: true
    logs_enabled: true
    collection_targets:
      - "victoria_metrics"
      - "victoria_logs"

vast_configuration:
  vast_endpoint: ""
  vast_metrics_port: 443
  metrics_path: "/api/prometheusmetrics/all"
  scrape_interval: "30s"
  scrape_timeout: "15s"
  tls_mode: "self_signed"
  vast_ca_cert_path: ""
  auth_mode: "basic"
| Parameter | Description |
|---|---|
metrics_enabled |
Enable or disable VAST metric collection (true or false) |
logs_enabled |
Enable or disable VAST log collection (true or false) |
collection_targets |
Where VAST data is sent. Supported: victoria_metrics, victoria_logs |
vast_endpoint |
IP address or hostname of the VAST Storage appliance |
vast_metrics_port |
Port for the VAST Prometheus exporter (default: 443) |
metrics_path |
URL path for Prometheus metrics endpoint |
scrape_interval / scrape_timeout |
How often and how long to scrape VAST metrics |
tls_mode |
TLS verification mode: self_signed or ca_signed |
vast_ca_cert_path |
Path to the CA certificate (required when tls_mode is ca_signed) |
auth_mode |
Authentication mode for VAST API: basic |
Step 6: Deploy the Cluster
Deploy the cluster by running the full playbook sequence
(prepare_oim.yml -> local_repo.yml -> build_image -> provision.yml).
provision.yml configures the shared vmagent to scrape the VAST Prometheus
endpoint. See Deploy the Telemetry Stack.
Important
If you enable VAST telemetry on an already-provisioned cluster, re-run provision.yml and then execute the telemetry.sh script on the K8s control plane. See Update Telemetry on a Running Cluster.
<K8s_NFS_mount_point>/telemetry/telemetry.sh
Verification
Verify VAST Telemetry Pods
-
Verify that the VictoriaMetrics pods are running:
Run on K8s control planekubectl get pods -n telemetry -o wide | grep vm
-
Verify that the VictoriaMetrics service is running:
Run on K8s control planekubectl get service -n telemetry -o wide | grep vm

-
Verify VMagent logs for VAST scraping to view recent logs:
Run on K8s control planeVMAGENT_POD=$(kubectl get pods -n telemetry -l app.kubernetes.io/name=vmagent -o jsonpath='{.items[0].metadata.name}') kubectl logs $VMAGENT_POD -n telemetry -c vmagent --tail=10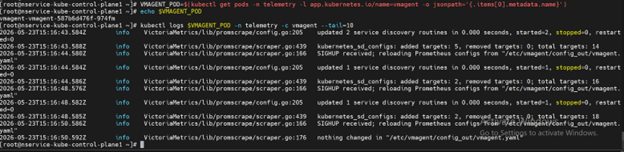
View VAST Metrics in VictoriaMetrics UI (VMUI)
Use the VMUI to validate that VAST telemetry data is being collected.
-
Note the External IP and port number of the VictoriaMetrics service:
Run on K8s control planekubectl get svc -n telemetry | grep vmselect
-
Access the VMUI in a web browser:
https://<external vmselect loadbalancer IP>:8481/select/0/vmui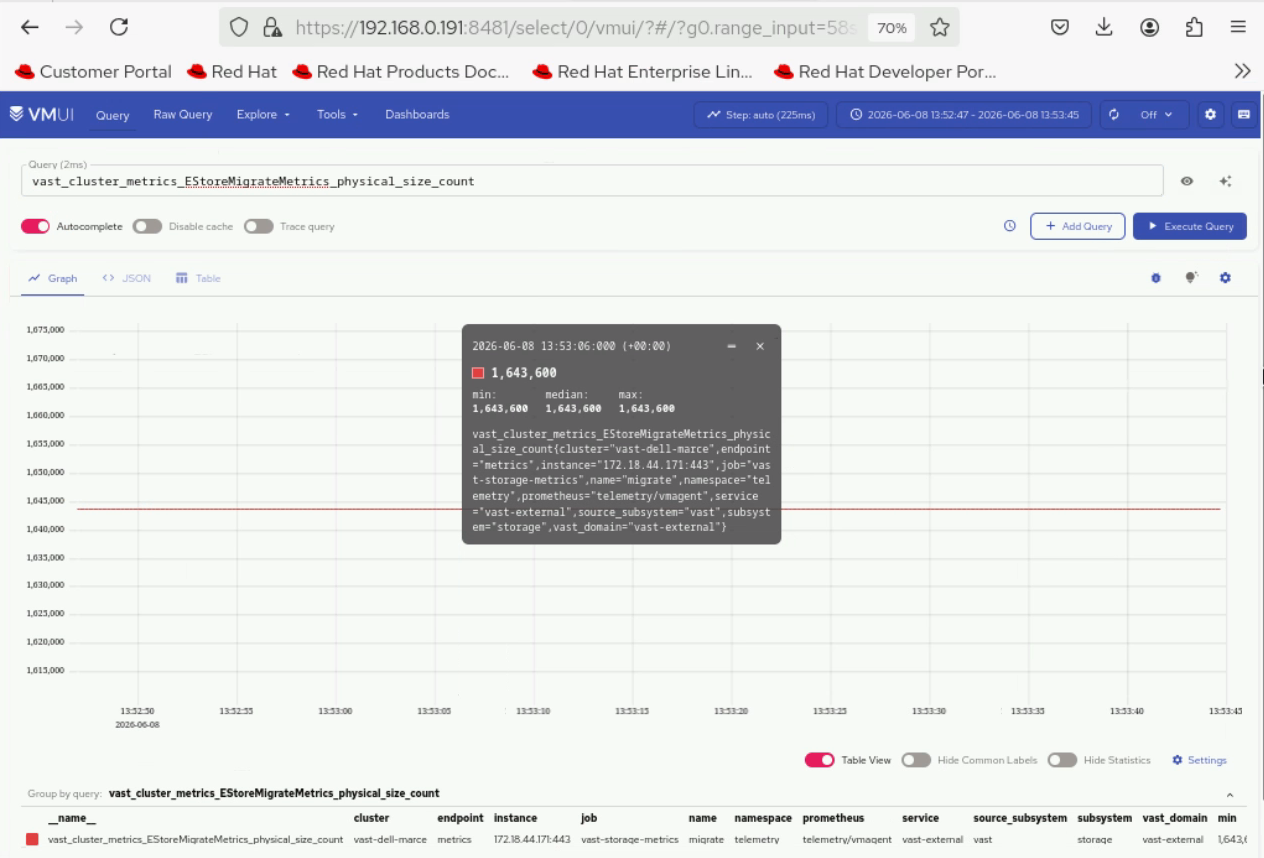
View VAST Logs in VictoriaLogs
-
Retrieve the VLAgent LoadBalancer IP and configure it on the VAST appliance:
Run on K8s control planekubectl get svc -n telemetry | grep -E "(vlagent|victoria-logs)"
-
Retrieve the external IP and port of the vlselect service:
Run on K8s control planekubectl get svc -n telemetry | grep vlselect
-
Access the VictoriaLogs UI in a web browser:
https://<external vlselect loadbalancer IP>:9471/select/vmui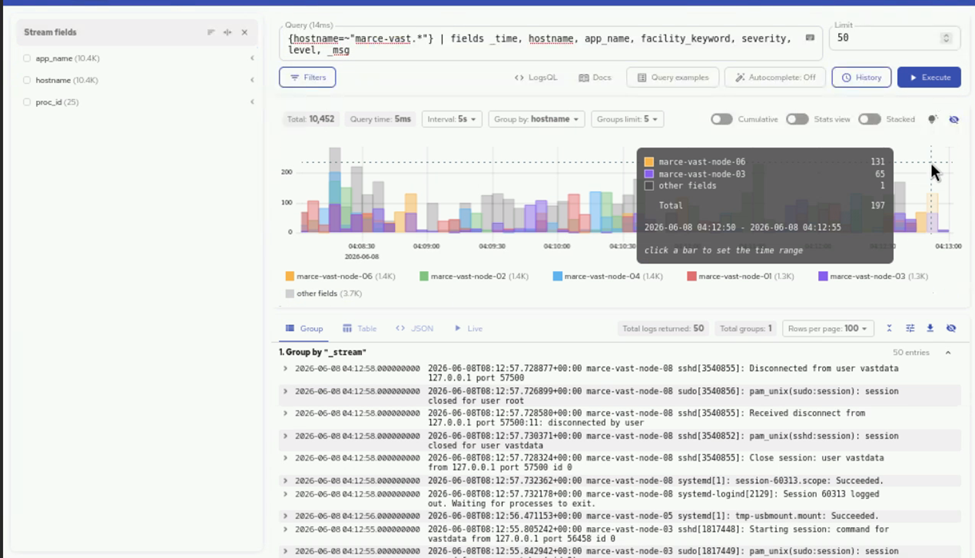
Next Steps
- Setup Telemetry -- Overview of all telemetry sources.
Troubleshooting
For common telemetry issues and resolutions, see Troubleshooting Telemetry.