Setup Telemetry
Omnia deploys a telemetry pipeline to collect, aggregate, and store hardware, OS-level, and storage telemetry data from across the cluster using VictoriaMetrics, VictoriaLogs, and Kafka.
For a summary of all supported telemetry sources, bridges and their sinks, see Supported Telemetry Sources, Bridges and Sinks.
Note
To enable any telemetry and log collections (iDRAC, LDMS, PowerScale, DCGM, UFM, VAST, or Vector), ensure that the service_k8s entry is present in the software_config.json file and the corresponding telemetry source fields are set to true in the telemetry_config.yml file.
Telemetry Architecture
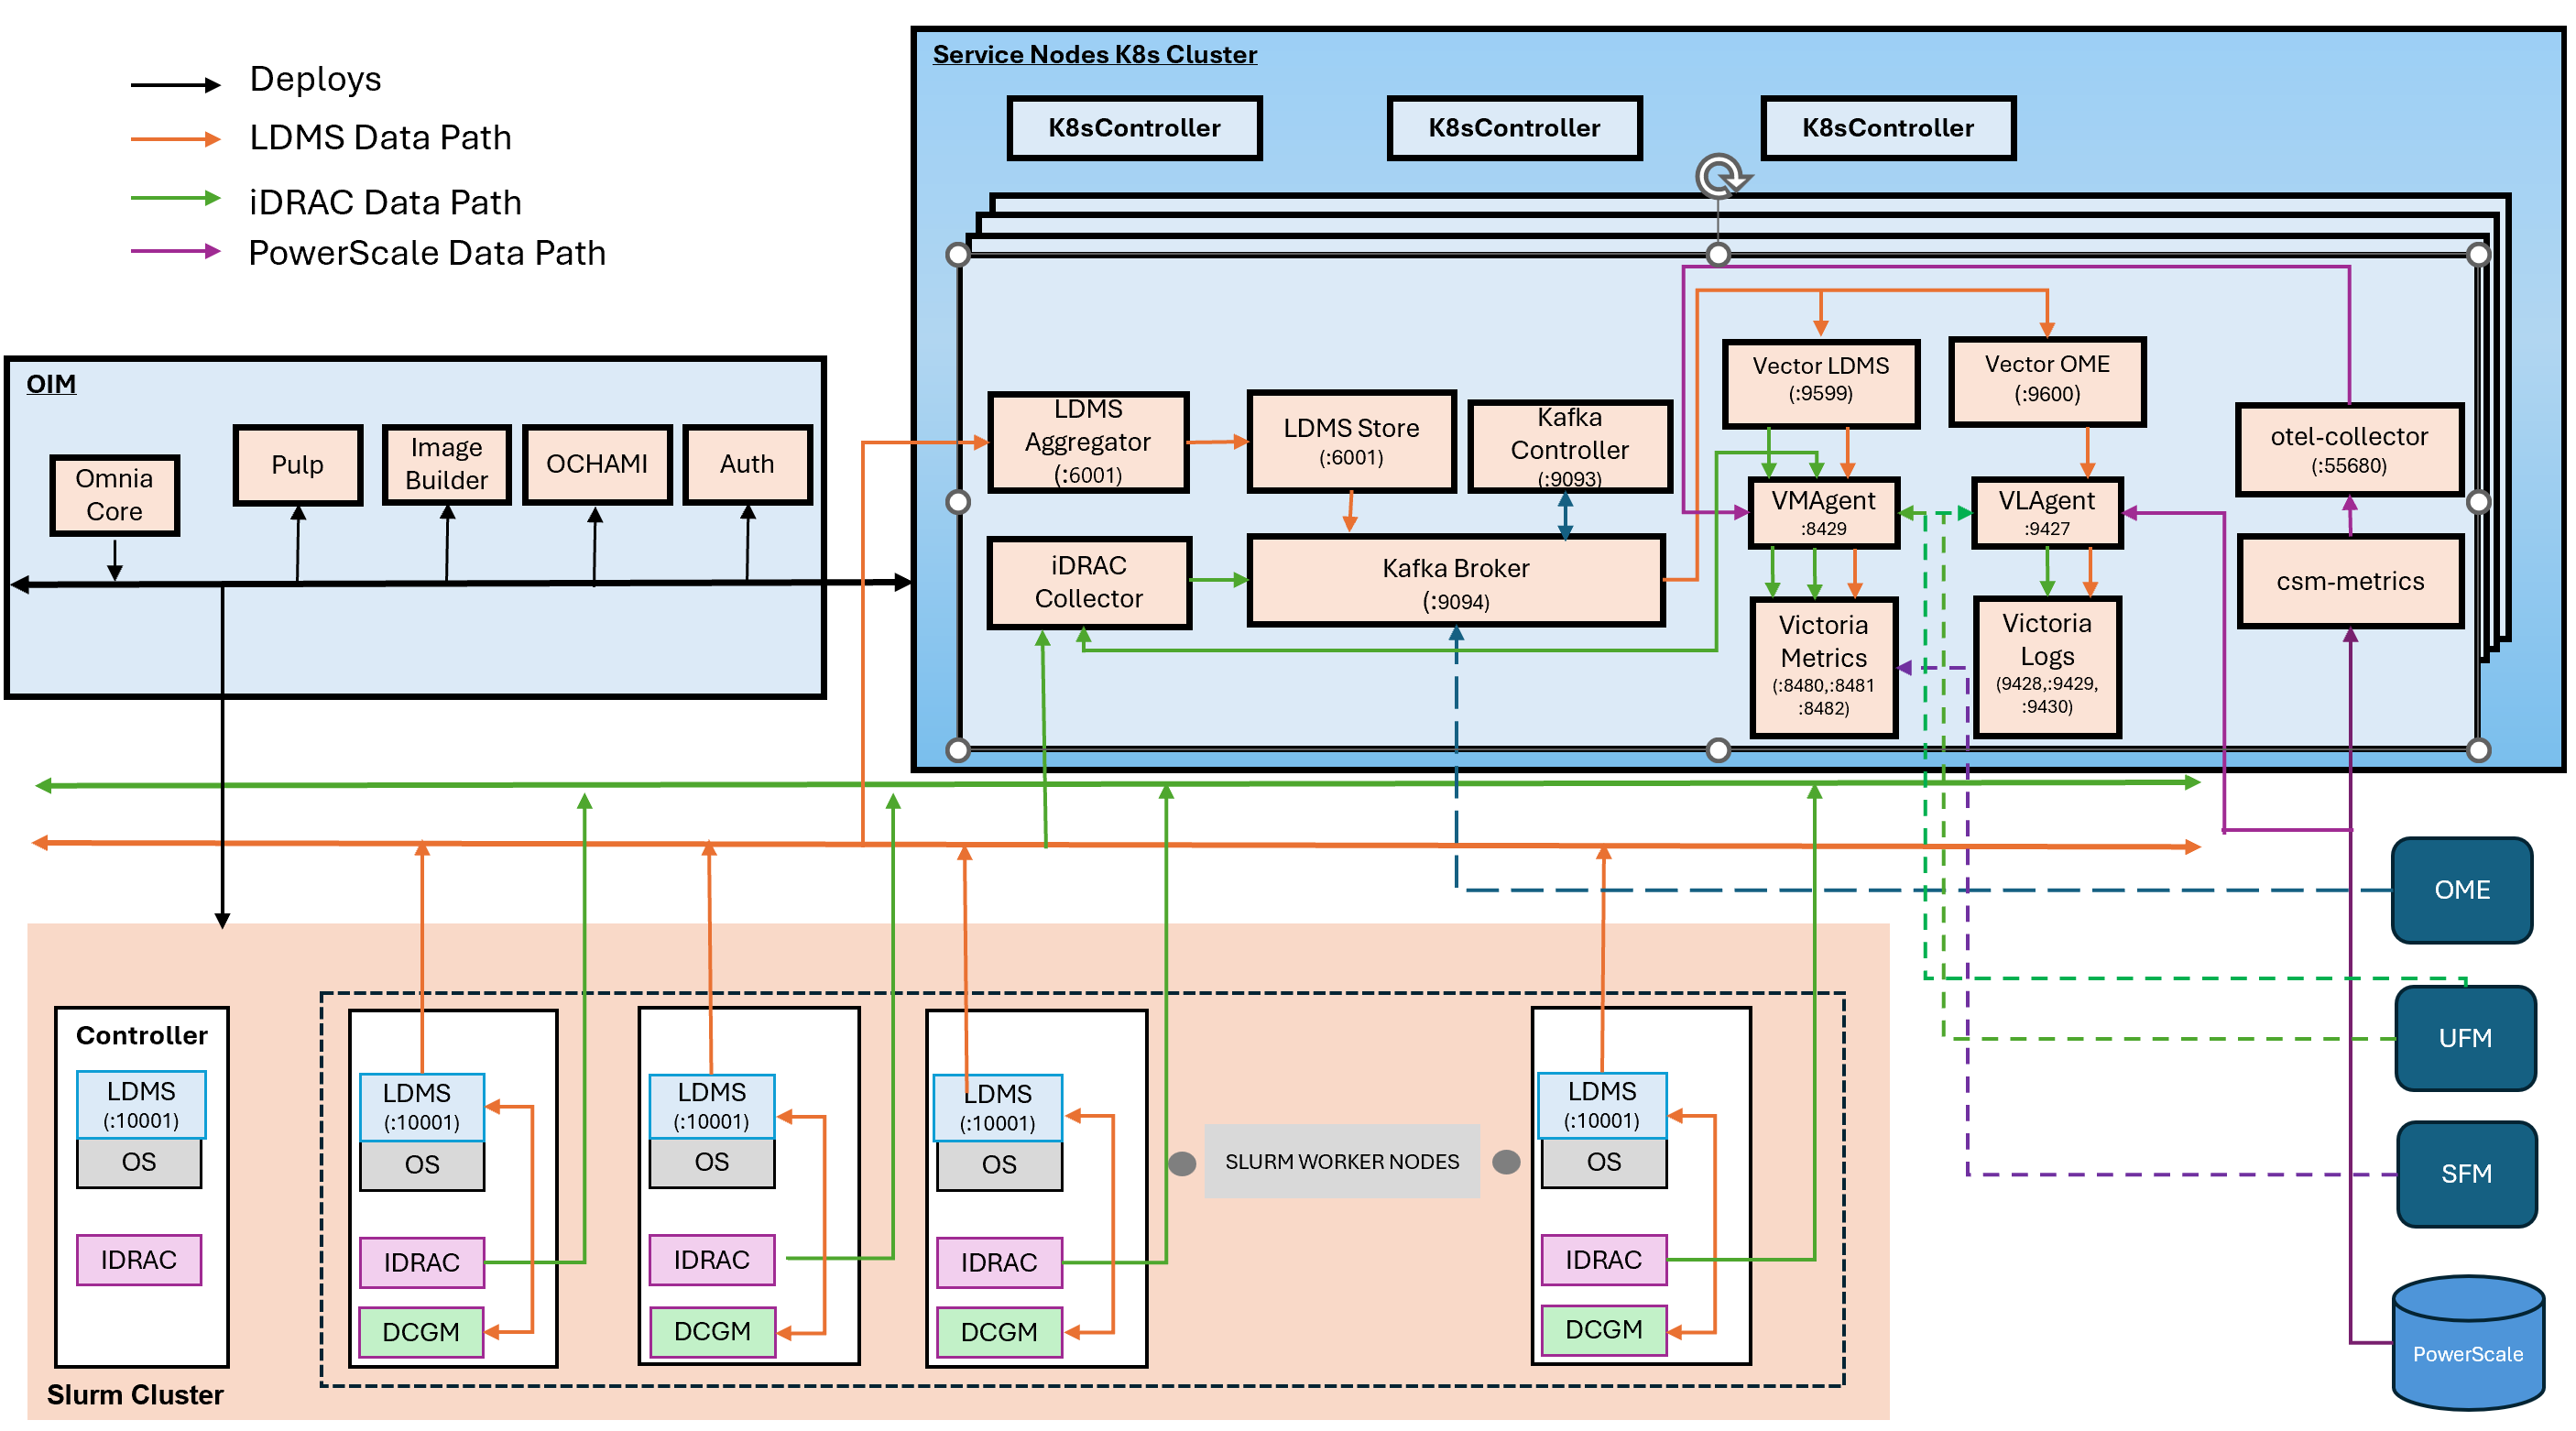
The following diagram illustrates the telemetry services deployed by Omnia and the data flow between the components:
Telemetry Components
OIM (Omnia Infrastructure Manager) -- Central management node that deploys and configures all telemetry services across the cluster.
Service Kubernetes Cluster -- Hosts telemetry collection and storage services:
- iDRAC Collector -- Collects hardware telemetry via Redfish API
- LDMS Aggregator / Store -- Receives and stores aggregated LDMS data
- Kafka Broker -- Streams telemetry data via Strimzi operator
- VMAgent -- Forwards metrics to VictoriaMetrics
- VictoriaMetrics Cluster -- Time-series database (vminsert, vmstorage, vmselect)
- VictoriaLogs Cluster -- Distributed log storage (vlinsert, vlstorage, vlselect)
- VLAgent -- Platform-managed log collection agent that receives logs from external sources
- Vector-LDMS / Vector-OME -- Kafka consumers that route data to Victoria stack via dedicated vmagent-vector and vlagent-vector instances
- karavi-metrics-powerscale -- Collects PowerScale metrics via CSM Observability
- otel-collector -- Forwards metrics to VictoriaMetrics and VictoriaLogs
Slurm Cluster -- Each Slurm compute node runs:
- LDMS Sampler -- Collects OS metrics (CPU, memory, network, and I/O)
- iDRAC -- Provides hardware health data (temperature, power, and fans)
For detailed data flow diagrams, see the respective configuration pages below.
Next Steps
Configure one or more telemetry sources, then deploy the cluster to bring up the telemetry stack. For the end-to-end playbook sequence, see Deploy the Telemetry Stack.