Integrate OME with Kafka for Telemetry Streaming
Configure OpenManage Enterprise (OME) to securely stream telemetry data to the Omnia Kafka pipeline using mutual TLS (mTLS).
Overview
This procedure describes how to integrate OpenManage Enterprise (OME) with the Omnia Kafka pipeline for secure telemetry data streaming. OME connects to the Kafka external mTLS listener (port 9094) and publishes telemetry data (inventory, health, alerts, audit logs) to Kafka topics. To route OME telemetry from Kafka to VictoriaMetrics and VictoriaLogs, enable the Vector-OME bridge.
Prerequisites
Complete the following before you configure OME telemetry. The OME source and the
Vector-OME bridge must be enabled before you provision the cluster, so that
Omnia creates the OME Kafka topics, ACLs, and the vector-ome-user KafkaUser. You
then connect the OME appliance to Kafka after the cluster is provisioned.
- The
omnia_corecontainer is deployed on the OIM. See Deploy Omnia Core. - The mapping file (
pxe_mapping_file.csv) is created. See Create Mapping File. - A running OpenManage Enterprise (OME) instance with nodes already discovered.
Procedure
Step 1: Add Required Software to software_config.json
OME telemetry uses the Kafka and Vector pipeline on the service Kubernetes cluster.
Ensure the service_k8s entry is present in software_config.json. Include an
aarch64 entry only if you have aarch64 nodes.
{
    "softwares": [
        {"name": "service_k8s", "version": "1.35.1", "arch": ["x86_64"]}
    ]
}
For the full file structure, see the software_config.json reference.
Step 2: Add Required Nodes to the Mapping File
OME telemetry requires a service Kubernetes cluster with Kafka exposed over a
MetalLB LoadBalancer. In pxe_mapping_file.csv, ensure the following functional
groups are present:
service_kube_control_plane(control plane nodes; three for an HA cluster)service_kube_node(at least one worker node)
FUNCTIONAL_GROUP_NAME,GROUP_NAME,SERVICE_TAG,PARENT_SERVICE_TAG,HOSTNAME,ADMIN_MAC,ADMIN_IP,BMC_MAC,BMC_IP,IB_NIC_NAME,IB_IP
service_kube_control_plane_x86_64,grp4,H94M8F3,,kcp1,BC:97:E1:F0:94:F0,172.16.107.96,b0:7b:25:d8:4a:f4,100.10.1.99,,
service_kube_node_x86_64,grp6,GZF6ZS3,,kn,EC:2A:72:32:C6:98,172.16.107.95,ec:2a:72:3b:a8:52,100.10.0.209,,
Ensure pod_external_ip_range is set in omnia_config.yml so MetalLB can assign
an external IP to the Kafka mTLS listener. For the full mapping file format, see the
PXE mapping file reference.
Step 3: Enable OME and Vector-OME in telemetry_config.yml
Enable the OME source and the Vector-OME bridge in telemetry_config.yml. OME
publishes to Kafka ome.* topics; the Vector-OME bridge consumes from Kafka and
routes metrics to VictoriaMetrics and logs to VictoriaLogs via dedicated
vmagent-vector and vlagent-vector instances.
telemetry_sources:
  ome:
    metrics_enabled: true
    logs_enabled: true
    collection_targets:
      - "kafka"

telemetry_bridges:
  vector_ome:
    metrics_enabled: true
    logs_enabled: true
For details on all parameters, see the telemetry_config.yml reference.
The following components are deployed based on the configured feature flags:
- vmagent-vector -- Deployed when
vector_ome > metrics_enabledistrue. - Vector-OME -- Deployed when
vector_ome > metrics_enabled = trueorvector_ome > logs_enabled = true. - vlagent-vector -- Deployed when
vector_ome > logs_enabled = true. - Kafka topics and ACLs -- For OME topics.
- KafkaUser resources -- For Vector-OME mTLS credentials (
vector-ome-user).
Note
Vector-OME requires a new KafkaUser (vector-ome-user) because OME is an external producer with a different security domain.
Step 4: Deploy the Cluster
Deploy the cluster by running the full playbook sequence
(prepare_oim.yml -> local_repo.yml -> build_image -> provision.yml).
provision.yml deploys Kafka, the Vector-OME bridge, the OME Kafka topics/ACLs,
and the vector-ome-user KafkaUser. See
Deploy the Telemetry Stack.
Important
If you enable OME telemetry on an already-provisioned cluster, re-run provision.yml and then execute the telemetry.sh script on the K8s control plane. See Update Telemetry on a Running Cluster.
<K8s_NFS_mount_point>/telemetry/telemetry.sh
Once the cluster is provisioned and the telemetry stack is running, connect the OME appliance to Kafka using the following steps.
Step 5: Retrieve Kafka Connection Details
-
Log in to the Service Kubernetes control plane.
-
Retrieve the Kafka LoadBalancer external IP:
Run on K8s control planekubectl get svc -n telemetry | grep kafkaNote the External IP of the Kafka LoadBalancer service (port 9094 for mTLS connections).
Step 6: Extract TLS Certificates
Extract the Kafka TLS certificates:
kubectl get secret -n telemetry kafka-external-tls -o jsonpath='{.data.ca\.crt}' | base64 --decode > ca.crt
kubectl get secret -n telemetry kafka-external-tls -o jsonpath='{.data.user\.crt}' | base64 --decode > user.crt
kubectl get secret -n telemetry kafka-external-tls -o jsonpath='{.data.user\.key}' | base64 --decode > user.key
Step 7: Create Client Certificate in .pfx Format
OME requires a .pfx format client certificate for mTLS authentication:
openssl pkcs12 -export -in user.crt -inkey user.key -certfile ca.crt -out client.pfx -password pass:<password>

Step 8: Configure OME Kafka Connectivity
-
Log in to the OME web UI.
-
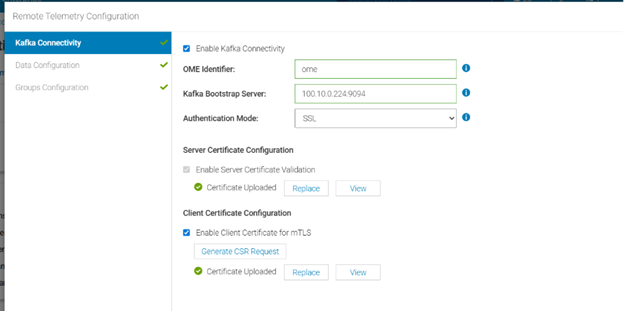
Navigate to Application Settings > Data Streaming > Remote Connectivity.
-
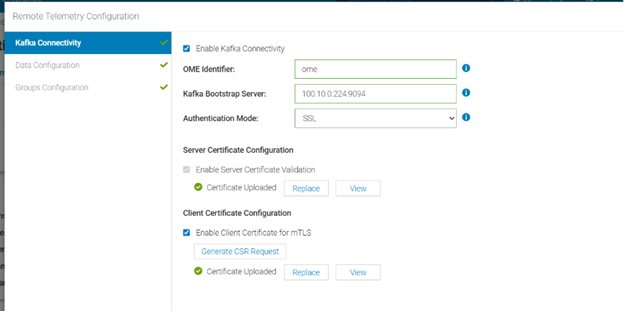
Select Kafka Connectivity and configure:
- Bootstrap Server:
<kafka-external-ip>:9094 - Security Protocol:
SSL
- Bootstrap Server:
-
Upload the client certificate (
client.pfx) and enter the password. -
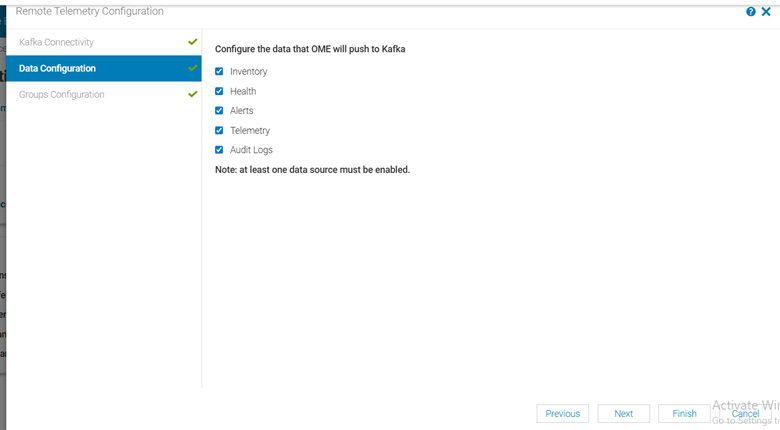
Configure Data Configuration to select the telemetry data types to stream:
-
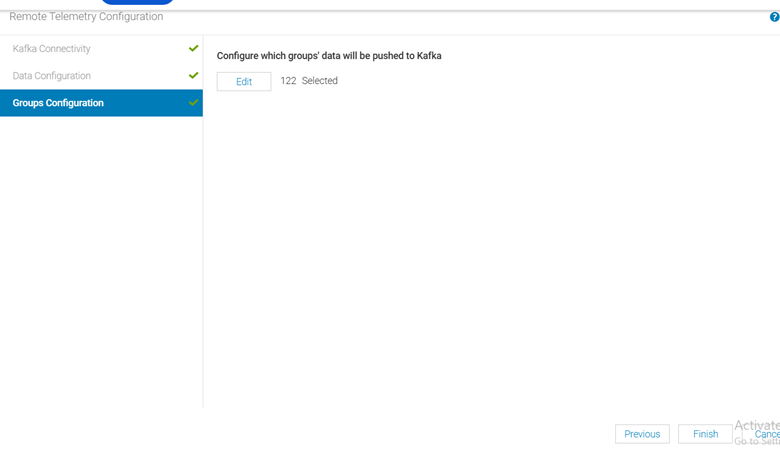
Configure Group Configuration to select the device groups to monitor:
-
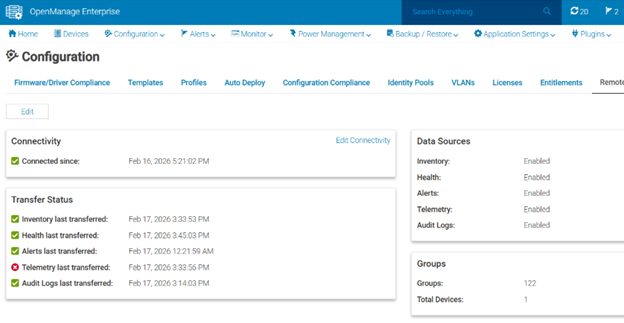
Save and verify the connectivity status shows as Connected:
Verification
Verify OME Messages in Kafka
To verify that OME telemetry data is being successfully published to the OME Kafka topics:
-
Log in to the Service Kubernetes control plane.
-
Set the required variables:
Run on K8s control planeKAFKA_LB_IP=<external IP of bridge-bridge-lb service> TOPIC=<OME Topic Name> GROUP=ome-consumer-group INSTANCE=ome-consumer -
Create a Kafka consumer:
Run on K8s control planecurl -s -X POST "http://$KAFKA_LB_IP:8080/consumers/$GROUP" \ -H 'content-type: application/vnd.kafka.v2+json' \ -d '{"name": "ome-consumer", "format": "json", "auto.offset.reset": "earliest"}' -
View the list of OME Kafka topics configured:
Run on K8s control planecurl -s -X GET "http://$KAFKA_LB_IP:8080/topics" | jq '.' -
Subscribe the consumer to the telemetry topic:
Run on K8s control planecurl -s -X POST "http://$KAFKA_LB_IP:8080/consumers/$GROUP/instances/$INSTANCE/subscription" \ -H 'content-type: application/vnd.kafka.v2+json' \ -d '{"topics": ["'"$TOPIC"'"]}' -
Consume messages from the topic:
Run on K8s control planewhile true; do curl -s -X GET "http://$KAFKA_LB_IP:8080/consumers/$GROUP/instances/$INSTANCE/records" \ -H 'accept: application/vnd.kafka.json.v2+json' | jq '.' sleep 2 done -
(Optional) Cleanup the consumer:
Run on K8s control planecurl -s -X DELETE "http://$KAFKA_LB_IP:8080/consumers/$GROUP/instances/$INSTANCE"
Note
- From beginning: Ensure
"auto.offset.reset": "earliest"when creating the consumer if you want existing data. - Message format: Use
"format": "json"only if producers publish JSON. Otherwise use"binary"and decode base64 payloads. - Throughput: Adjust polling interval; bridge returns empty array when no new records.
- 404/409 errors: 404 usually means wrong group/instance name; 409 means already subscribed.
View OME Metrics in VictoriaMetrics UI (VMUI)
To verify that OME telemetry data is being successfully routed from Kafka to VictoriaMetrics using Vector:
-
Access the VMUI in a web browser:
https://<external vmselect loadbalancer IP>:8481/select/0/vmui -
Navigate to the Explore tab.
-
Run the following query to retrieve health metrics from OME:
last_over_time({source_subsystem="ome", type="healty"}[24h])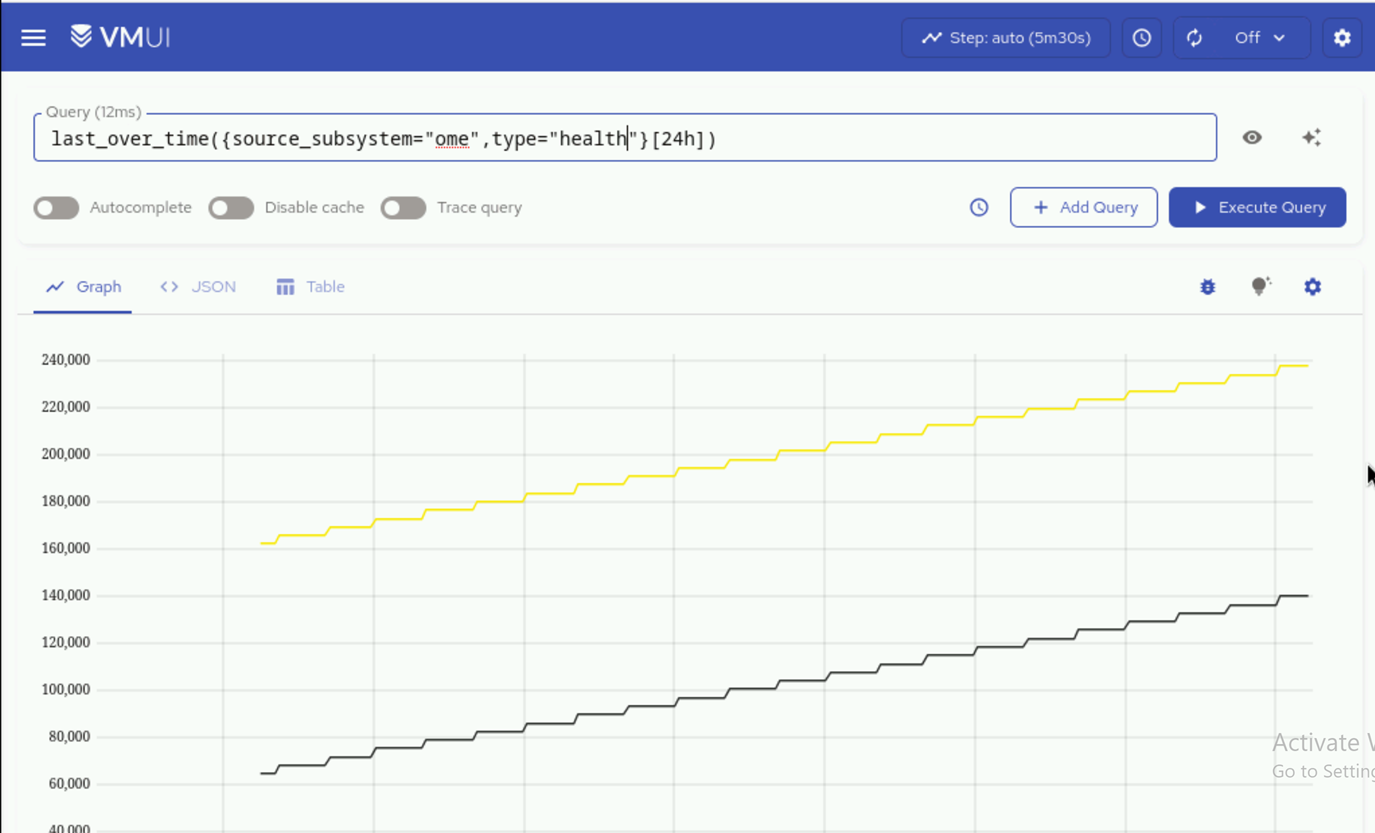
Note
source_subsystem=ome comes from the ome_identifier that the user has given in the telemetry_config.yml input file and the suffix after the dot (i.e., health, inventory, auditlogs) is coming from OME.
- Verify that OME-related metrics are displayed in the results.
Note
Ensure that the Vector-OME bridge is enabled in telemetry_config.yml (telemetry_bridges > vector_ome > metrics_enabled: true) for metrics data to flow from Kafka to VictoriaMetrics.
View OME Logs in VictoriaLogs
To verify that OME telemetry data is being successfully routed from Kafka to VictoriaLogs using Vector:
-
Access the VictoriaLogs UI in a web browser:
https://<external vlselect loadbalancer IP>:9471/select/vmui -
Navigate to the Select tab.
-
In the query field, run the following query to filter for OME logs:
_msg_topic:ome.auditlogs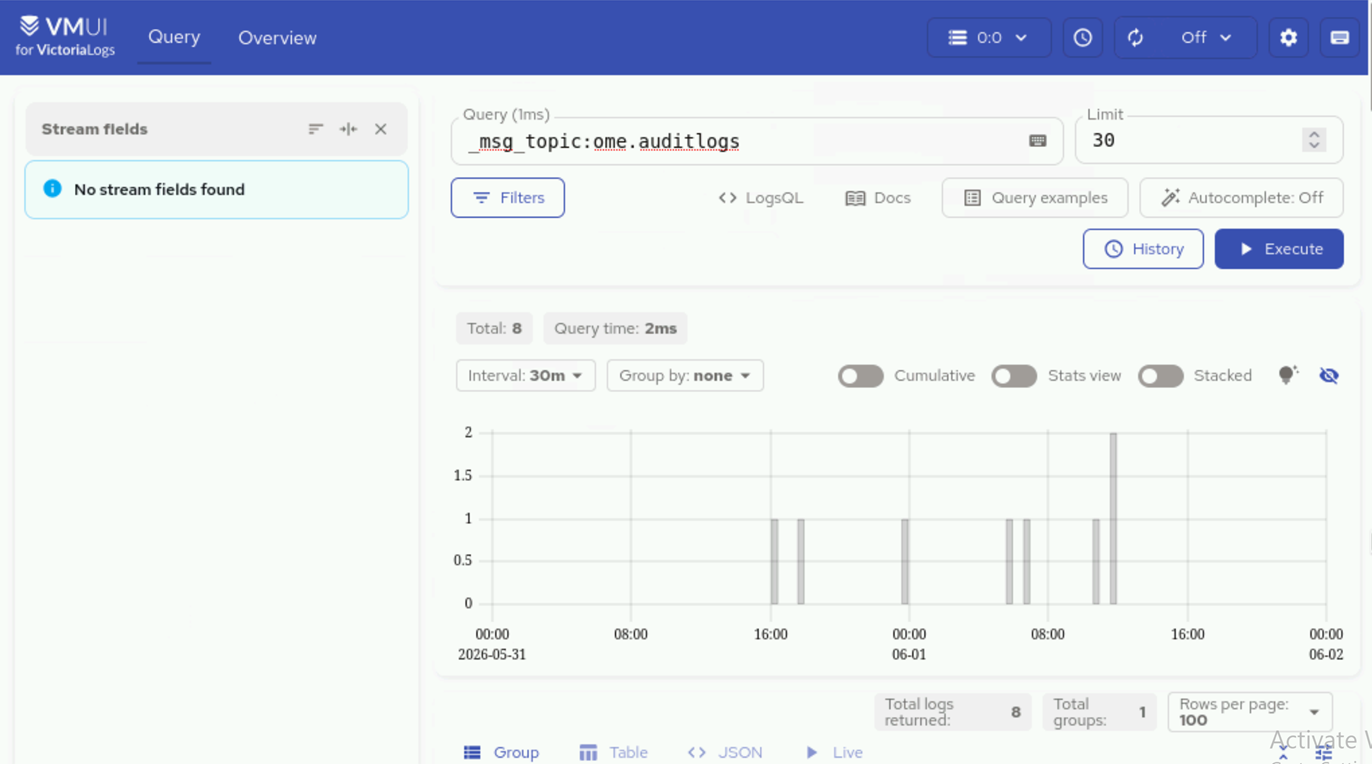
-
Verify that OME-related logs are displayed in the results.
Note
Ensure that the Vector-OME bridge is enabled in telemetry_config.yml (telemetry_bridges > vector_ome > logs_enabled: true) for logs data to flow from Kafka to VictoriaLogs.
Next Steps
- Setup Telemetry -- Overview of all telemetry sources.
Troubleshooting
For common telemetry issues and resolutions, see Troubleshooting Telemetry.