Configure LDMS Telemetry
Configure deployment of Lightweight Distributed Metric Service (LDMS) to collect in-band telemetry from Slurm clusters.
Overview
LDMS collects system metrics such as CPU, memory, network, I/O, and Slurm job statistics. During deployment, Omnia attaches LDMS aggregator and store pods to the admin network. This improves throughput between Slurm nodes and the Kubernetes cluster.
Components
- LDMS producer (collector) -- Collects local system metrics and runs on Slurm controller, compute, and login nodes.
- LDMS aggregator -- Receives and aggregates metrics from producers. Runs as a Kubernetes pod.
- LDMS store -- Buffers and stores metric batches reliably. Runs as a Kubernetes pod.
- Kafka broker -- Handles telemetry streaming for consumption by downstream systems.
For more details on LDMS, see Lightweight Distributed Metric Service.
Data Flow
Slurm Compute Nodes (LDMS Sampler) → LDMS Aggregator → LDMS Store → Kafka
                                                                      ↓
                                                        (Optional: Vector-LDMS Bridge)
                                                                      ↓
                                                        Vector-LDMS → vmagent-vector → VictoriaMetrics
LDMS data is always sent to Kafka. To route LDMS metrics to VictoriaMetrics, enable the Vector-LDMS bridge.
Supported Metrics
The following LDMS plugins are supported in Omnia:
| Plugin | Metrics Collected |
|---|---|
meminfo |
Memory usage statistics |
procstat2 |
Process statistics |
vmstat |
Virtual memory statistics |
loadavg |
System load average |
procnetdev2 |
Network interface statistics |
Note
The LDMS Slurm sampler metrics are not supported in the current telemetry deployment.
Prerequisites
Complete the following before you configure LDMS telemetry. Provisioning the cluster happens after this configuration, as part of the deployment sequence.
- The
omnia_corecontainer is deployed on the OIM. See Deploy Omnia Core. - The mapping file (
pxe_mapping_file.csv) is created. See Create Mapping File. - Access to the
ovis-ldmsRPM repository for each node architecture in your cluster (x86_64 and/or aarch64).
Procedure
Step 1: Add Required Software to software_config.json
LDMS requires the LDMS sampler on Slurm nodes and the LDMS aggregator on the
service K8s cluster. Add the following entries to the softwares list in
software_config.json. If any entry is missing, Omnia skips LDMS deployment and
logs an informational message. For the full file structure, see the
software_config.json reference.
{
    "softwares": [
        {"name": "service_k8s", "version": "1.35.1", "arch": ["x86_64"]},
        {"name": "slurm_custom", "arch": ["x86_64", "aarch64"]},
        {"name": "ldms", "arch": ["x86_64", "aarch64"]}
    ]
}
Note
List each architecture present in your cluster in the arch array. Include
aarch64 for slurm_custom and ldms only if you have aarch64 Slurm nodes.
Step 2: Configure LDMS Repositories in local_repo_config.yml
The ldms software entry pulls the ovis-ldms RPM from a repository named ldms.
Define this repository for each architecture in your cluster under
user_repo_url_x86_64 and/or user_repo_url_aarch64 in local_repo_config.yml.
user_repo_url_x86_64:
  - { url: "http://repos.example.com/ldms-x86_64/", gpgkey: "", sslcacert: "", sslclientkey: "", sslclientcert: "", name: "ldms" }

# Provide the aarch64 repository only if you have aarch64 Slurm nodes
user_repo_url_aarch64:
  - { url: "http://repos.example.com/ldms-aarch64/", gpgkey: "", sslcacert: "", sslclientkey: "", sslclientcert: "", name: "ldms" }
Important
The repository name must be exactly ldms to match the repo_name referenced
by the ovis-ldms package. See the
local_repo_config.yml reference.
Step 3: Add Required Nodes to the Mapping File
LDMS requires both a service K8s cluster (aggregator) and Slurm nodes (samplers).
In pxe_mapping_file.csv, ensure the following functional groups are present:
slurm_control_node(mandatory; Slurm controller running the LDMS sampler)slurm_node(Slurm compute nodes running the LDMS sampler)service_kube_control_plane(three control plane nodes)service_kube_node(at least one worker node)
FUNCTIONAL_GROUP_NAME,GROUP_NAME,SERVICE_TAG,PARENT_SERVICE_TAG,HOSTNAME,ADMIN_MAC,ADMIN_IP,BMC_MAC,BMC_IP,IB_NIC_NAME,IB_IP
slurm_control_node_x86_64,grp0,JS8MN34,,scnode,04:32:01:DD:9D:F0,172.16.107.91,6c:3c:8c:85:bd:a6,100.10.0.115,,
slurm_node_x86_64,grp1,1T8MN34,GZF6ZS3,snode1,04:32:01:DE:18:D0,172.16.107.92,6c:3c:8c:85:be:a6,100.10.0.116,,
service_kube_control_plane_x86_64,grp4,H94M8F3,,kcp1,BC:97:E1:F0:94:F0,172.16.107.96,b0:7b:25:d8:4a:f4,100.10.1.99,,
service_kube_control_plane_x86_64,grp5,2LXT933,,kcp2,BC:97:E1:F0:95:10,172.16.107.97,b0:7b:25:d8:4b:04,100.10.1.100,,
service_kube_control_plane_x86_64,grp7,8X697C3,,kcp3,BC:97:E1:F0:95:30,172.16.107.98,b0:7b:25:d8:4b:14,100.10.1.101,,
service_kube_node_x86_64,grp6,GZF6ZS3,,kn,EC:2A:72:32:C6:98,172.16.107.95,ec:2a:72:3b:a8:52,100.10.0.209,,
Note
If you have aarch64 Slurm nodes, add rows with the _aarch64 suffix (for example, slurm_node_aarch64) to the mapping file.
For the full format, see the PXE mapping file reference.
Step 4: Enable LDMS in telemetry_config.yml
Configure LDMS and Kafka settings in telemetry_config.yml. For details on all parameters, see the telemetry_config.yml reference.
telemetry_sources:
  ldms:
    metrics_enabled: true
    collection_targets:
      - "kafka"

ldms_configurations:
  agg_port: 6001
  store_port: 6001
  sampler_port: 10001
  sampler_plugins:
    - plugin_name: meminfo
      config_parameters: ""
      activation_parameters: "interval=30000000"
    - plugin_name: procstat2
      config_parameters: ""
      activation_parameters: "interval=30000000"
    - plugin_name: vmstat
      config_parameters: ""
      activation_parameters: "interval=30000000"
    - plugin_name: loadavg
      config_parameters: ""
      activation_parameters: "interval=30000000"
    - plugin_name: procnetdev2
      config_parameters: ""
      activation_parameters: "interval=30000000 offset=0"
| Parameter | Description |
|---|---|
metrics_enabled |
Enable or disable LDMS metrics collection (true or false) |
collection_targets |
LDMS data is sent to Kafka. To route to VictoriaMetrics, enable the Vector-LDMS bridge |
agg_port / store_port / sampler_port |
Network ports for LDMS aggregator, store, and sampler |
sampler_plugins |
List of LDMS sampler plugins to activate. At least one plugin is mandatory |
Note
For LDMS telemetry configuration, at least one sampler plugin is mandatory to collect system metrics.
Step 5: Enable Vector-LDMS Bridge (Optional)
To route LDMS metrics from Kafka to VictoriaMetrics, enable the Vector-LDMS bridge in telemetry_config.yml. Vector-LDMS consumes from the Kafka ldms topic, transforms Avro-encoded LDMS data to Prometheus metric format, and routes to VictoriaMetrics via a dedicated vmagent-vector instance.
For more details on Vector, see Vector Documentation.
Configure telemetry_config.yml to enable Vector-LDMS:
telemetry_bridges:
  vector_ldms:
    metrics_enabled: true
For details on all parameters, see the telemetry_config.yml reference.
The following components are deployed when vector_ldms > metrics_enabled = true:
- vmagent-vector -- Dedicated vmagent instance for Vector write-buffer. Accepts
prometheus_remote_writeon port 8429, buffers to disk, and forwards to vminsert. - Vector-LDMS -- Kafka consumer pod for LDMS metrics.
Note
Vector-LDMS reuses the existing kafkapump KafkaUser for mTLS credentials.
Step 6: Deploy the Cluster
Deploy the cluster by running the full playbook sequence
(prepare_oim.yml -> local_repo.yml -> build_image -> provision.yml). See
Deploy the Telemetry Stack.
During deployment, Omnia:
- Downloads the
ovis-ldmsRPM and telemetry images vialocal_repo.yml. - Deploys the LDMS aggregator (Helm chart) and Kafka to the service K8s cluster
(
provision.yml->telemetry.sh). - Installs the LDMS sampler on each Slurm node via cloud-init.
- Deploys the Vector-LDMS bridge if enabled in Step 5.
Important
If you enable LDMS or the Vector-LDMS bridge on an already-provisioned cluster,
re-run provision.yml and then execute the telemetry.sh script on the K8s
control plane. See
Update Telemetry on a Running Cluster.
<K8s_NFS_mount_point>/telemetry/telemetry.sh
Verification
Verify LDMS Telemetry Pods
-
Verify that the LDMS telemetry pods are running:
Run on K8s control planekubectl get pods -n telemetry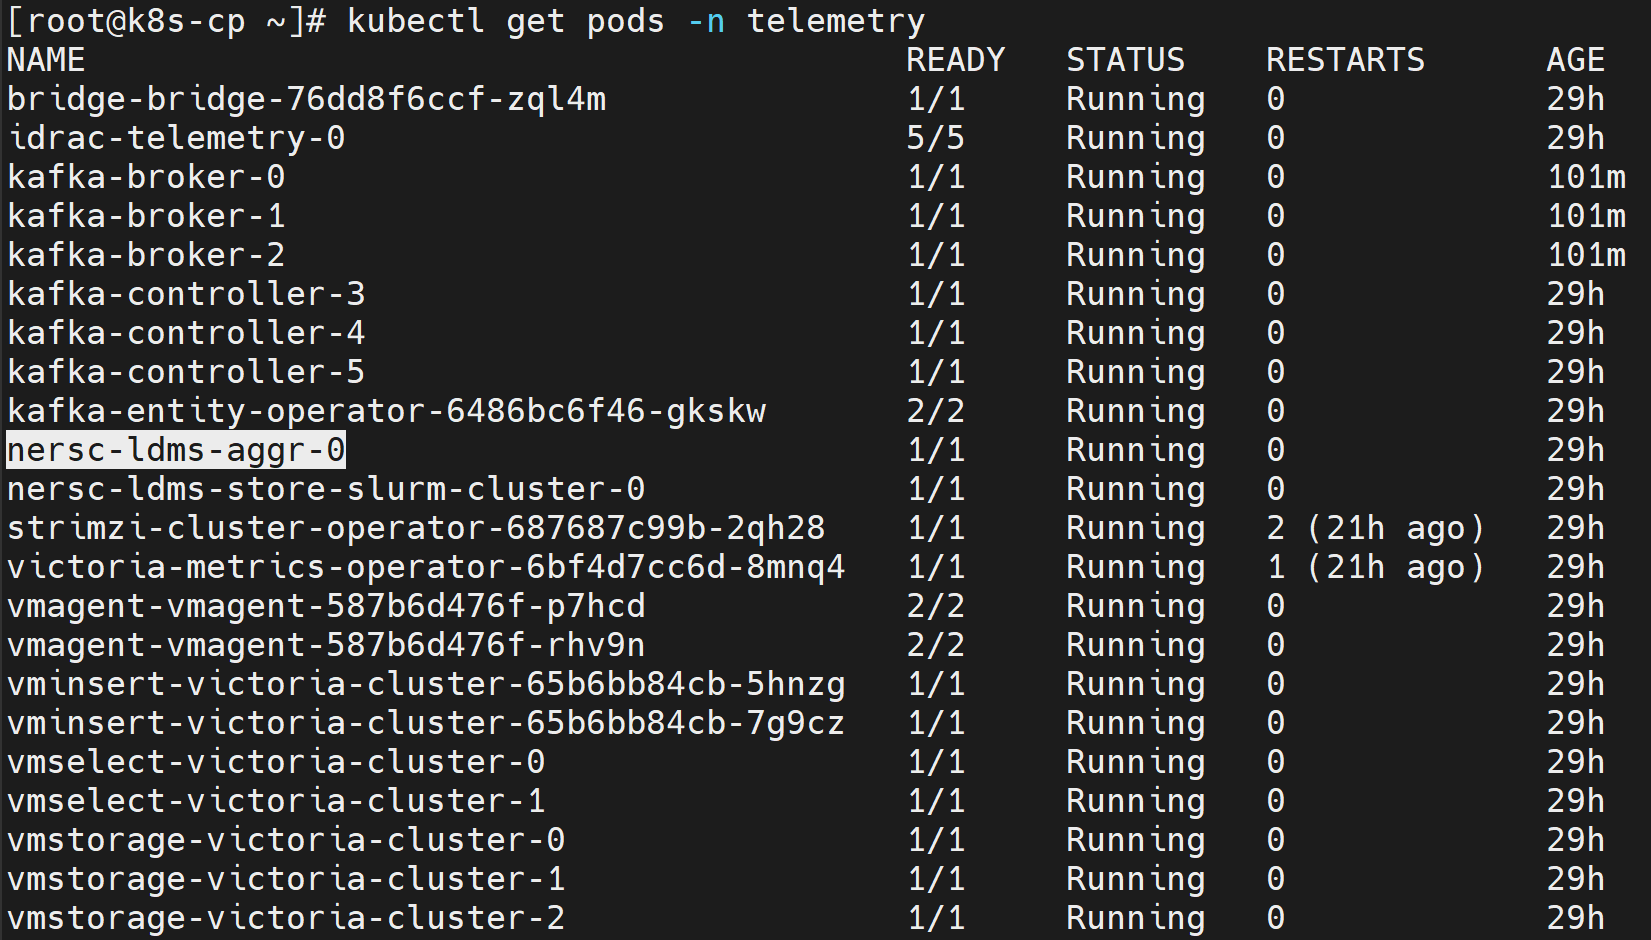
Verify LDMS Messages in Kafka
To verify that LDMS telemetry data is being successfully published to the ldms Kafka topic:
-
Log in to the Service Kubernetes control plane.
-
List the telemetry services to identify the
bridge-bridge-lbexternal IP:Run on K8s control planekubectl get svc -n telemetry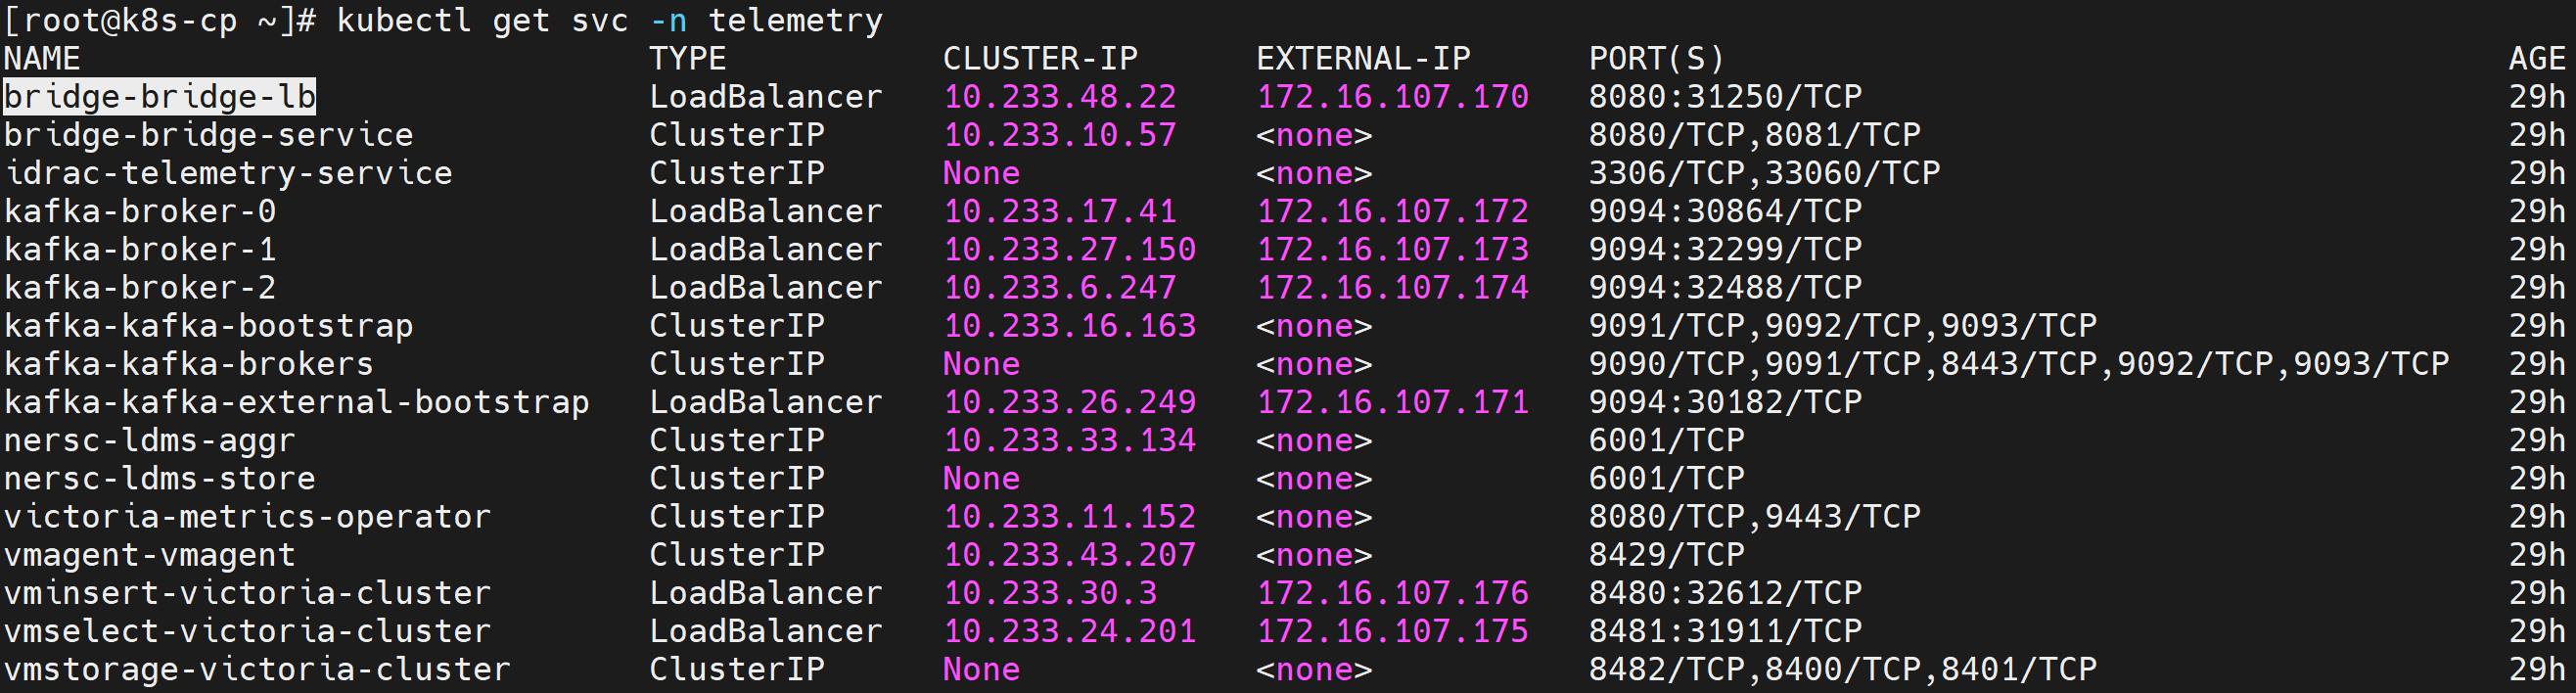
-
Set the required variables:
Run on K8s control planeKAFKA_LB_IP=<external IP of bridge-bridge-lb service> TOPIC=ldms GROUP=ldms-consumer-group INSTANCE=ldms-consumer-1 -
Create a Kafka consumer:
Run on K8s control planecurl -X POST http://$KAFKA_LB_IP:8080/consumers/ldms-consumer-group \ -H 'content-type: application/vnd.kafka.v2+json' \ -d '{ "name": "ldms-consumer-1", "format": "json", "auto.offset.reset": "latest", "enable.auto.commit": true }' -
View the list of LDMS Kafka topics configured:
Run on K8s control planecurl -s -X GET "http://$KAFKA_LB_IP:8080/topics" | jq '.' -
Subscribe the consumer to the LDMS topic:
Run on K8s control planecurl -X POST http://$KAFKA_LB_IP:8080/consumers/ldms-consumer-group/instances/ldms-consumer-1/subscription \ -H 'content-type: application/vnd.kafka.v2+json' \ -d '{"topics": ["ldms"]}' -
Consume messages from the topic:
Run on K8s control planewhile true; do curl -X GET http://$KAFKA_LB_IP:8080/consumers/ldms-consumer-group/instances/ldms-consumer-1/records \ -H 'accept: application/vnd.kafka.json.v2+json' | jq '.' ; sleep 2; done
If telemetry is flowing correctly, the output contains JSON-formatted LDMS telemetry records.
Note
When new nodes are added, ensure the nodes are up and cloud-init has completed successfully (check /var/log/cloud-init-output.log on each node). Then, create a new Kafka consumer group with a unique name (e.g., ldms-new-nodes-group) to verify metrics from the newly added nodes. Wait 2-3 minutes after discovery completes before checking.
Verify TLS Connectivity
-
Run the Kafka TLS test job:
Run on K8s control planecd /<nfs client mount path of the service k8s cluster>/telemetry/deployments/test kubectl apply -f kafka.tls_test_job.yaml -
After the job completes, check the logs to confirm that the TLS connection is successful:
Run on K8s control planekubectl logs kafka-tls-test-xxx -n telemetry
View LDMS Metrics in VictoriaMetrics UI (VMUI)
LDMS metrics are routed to VictoriaMetrics via the Vector-LDMS bridge.
-
Verify that the Vector-LDMS pod is running:
Run on K8s control planekubectl get pods -n telemetry | grep vector-ldms
-
Verify that the vmagent-vector pod is running:
Run on K8s control planekubectl get pods -n telemetry | grep vmagent-vector
-
Verify that the VictoriaMetrics service is running:
Run on K8s control planekubectl get service -n telemetry | grep vm
-
Note the External IP and port number of the VictoriaMetrics service.
-
Access the VMUI in a web browser:
https://<external vmselect loadbalancer IP>:8481/select/0/vmui -
Verify that metrics are reaching VictoriaMetrics by querying the VMUI. For example, the following query displays LDMS-related metrics:
{__name__=~"ldms_.*"}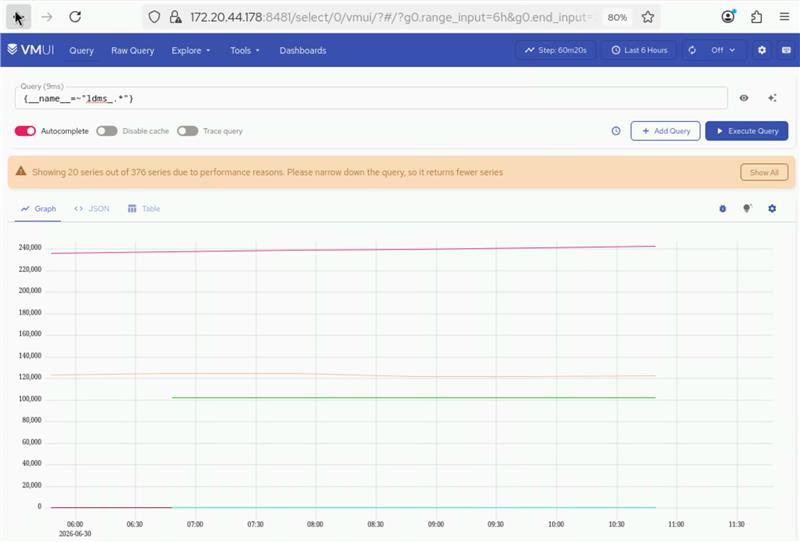
Next Steps
- Setup Telemetry -- Overview of all telemetry sources.
Troubleshooting
For common telemetry issues and resolutions, see Troubleshooting Telemetry.