Configure SFM Telemetry
Configure Smart Fabric Manager (SFM) to securely stream telemetry metrics to VictoriaMetrics in the Service Kubernetes cluster.
Overview
SFM collects network telemetry metrics including transceiver DOM readings, queue statistics, interface counters, and error counters from the managed fabric. SFM streams data directly to VictoriaMetrics via Prometheus Remote Write.
Components
- SFM Prometheus Exporter -- Collects network telemetry metrics from the managed fabric and exports them via Prometheus Remote Write.
- vminsert -- VictoriaMetrics ingestion endpoint that receives metrics over TLS from SFM.
Data Flow
SFM (Smart Fabric Manager) → Prometheus Remote Write → vminsert → VictoriaMetrics
Supported Metrics
| Category | Metrics Collected |
|---|---|
| Transceiver DOM | Optical power (TX/RX), temperature, voltage, bias current |
| Queue Statistics | Queue depth, egress queue counters, multicast queue counters |
| Interface Counters | Interface throughput (TX/RX bytes), packet counts, error counts, drop counts |
| Error Counters | CRC errors, alignment errors, symbol errors, FCS errors |
For the complete list of SFM telemetry metrics, see SFM Metrics Reference.
Prerequisites
Complete the following before you configure SFM telemetry. You provision the cluster first (which deploys VictoriaMetrics), then configure SFM to push metrics to it via Prometheus Remote Write.
- The
omnia_corecontainer is deployed on the OIM. See Deploy Omnia Core. - The mapping file (
pxe_mapping_file.csv) is created. See Create Mapping File. - SFM (Smart Fabric Manager) must be operational and accessible from the service Kubernetes cluster.
Procedure
Step 1: Add Required Software to software_config.json
SFM streams metrics to VictoriaMetrics running on the service Kubernetes cluster.
Ensure the service_k8s entry is present in software_config.json. Include an
aarch64 entry only if you have aarch64 nodes.
{
    "softwares": [
        {"name": "service_k8s", "version": "1.35.1", "arch": ["x86_64"]}
    ]
}
For the full file structure, see the software_config.json reference.
Step 2: Add Required Nodes to the Mapping File
SFM telemetry requires a service Kubernetes cluster with VictoriaMetrics exposed
over a MetalLB LoadBalancer. In pxe_mapping_file.csv, ensure the following
functional groups are present:
service_kube_control_plane(three control plane nodes)service_kube_node(at least one worker node)
FUNCTIONAL_GROUP_NAME,GROUP_NAME,SERVICE_TAG,PARENT_SERVICE_TAG,HOSTNAME,ADMIN_MAC,ADMIN_IP,BMC_MAC,BMC_IP,IB_NIC_NAME,IB_IP
service_kube_control_plane_x86_64,grp4,H94M8F3,,kcp1,BC:97:E1:F0:94:F0,172.16.107.96,b0:7b:25:d8:4a:f4,100.10.1.99,,
service_kube_control_plane_x86_64,grp5,2LXT933,,kcp2,BC:97:E1:F0:95:10,172.16.107.97,b0:7b:25:d8:4b:04,100.10.1.100,,
service_kube_control_plane_x86_64,grp7,8X697C3,,kcp3,BC:97:E1:F0:95:30,172.16.107.98,b0:7b:25:d8:4b:14,100.10.1.101,,
service_kube_node_x86_64,grp6,GZF6ZS3,,kn,EC:2A:72:32:C6:98,172.16.107.95,ec:2a:72:3b:a8:52,100.10.0.209,,
Ensure pod_external_ip_range is set in omnia_config.yml so MetalLB can assign
an external IP to the vminsert service. For the full mapping file format, see the
PXE mapping file reference.
Step 3: Deploy the Cluster
Deploy the cluster by running the full playbook sequence
(prepare_oim.yml -> local_repo.yml -> build_image -> provision.yml).
provision.yml deploys VictoriaMetrics in the telemetry namespace. See
Deploy the Telemetry Stack.
Once the cluster is provisioned and VictoriaMetrics is running, configure SFM to stream metrics to it using the following steps.
Step 4: Retrieve VictoriaMetrics Connection Details
-
Log in to the Service Kubernetes control plane.
-
Run the following commands to retrieve the VictoriaMetrics connection details:
Run on K8s control planekubectl get svc -n telemetry | grep vminsert -
Note the External IP of the
vminsertLoadBalancer service. -
Run the following command to extract the VictoriaMetrics TLS certificates:
Run on K8s control planekubectl get secret -n telemetry vminsert-tls -o jsonpath='{.data.ca\.crt}' | base64 --decode > ca.crt kubectl get secret -n telemetry vminsert-tls -o jsonpath='{.data.tls\.crt}' | base64 --decode > tls.crt kubectl get secret -n telemetry vminsert-tls -o jsonpath='{.data.tls\.key}' | base64 --decode > tls.key
Step 5: Configure SFM Prometheus Remote Write
-
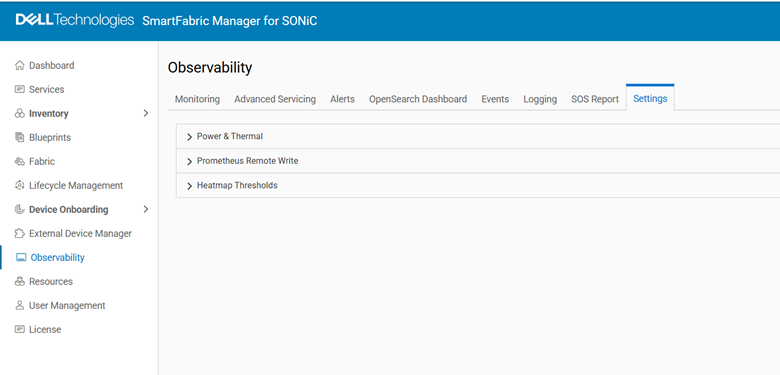
Log in to the SFM web UI.
-
Navigate to Settings > Observability.
-
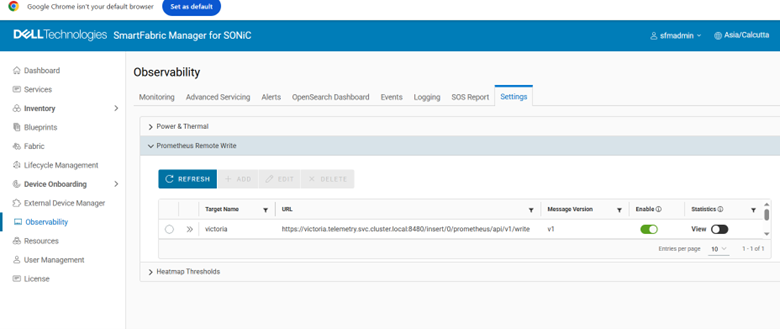
Select Prometheus Remote Write to configure remote write settings.
-
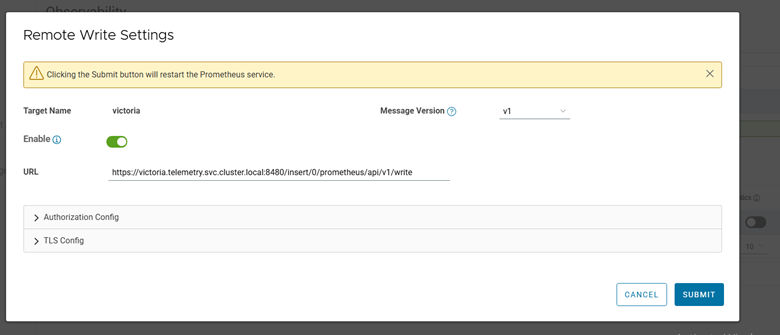
Configure the remote write settings:
- Remote Write URL:
https://<vminsert external IP>:8480/insert/0/prometheus/api/v1/write - Write Interval: Set based on desired metric frequency
- Remote Write URL:
-
Upload the TLS certificates (
ca.crt,tls.crt,tls.key) extracted in the previous step.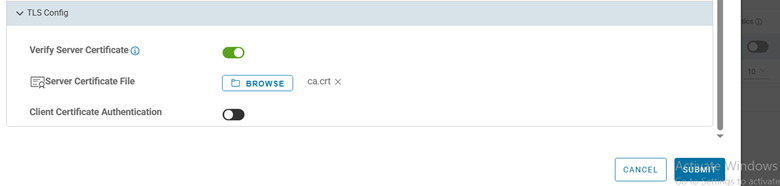
-
Save and apply the configuration.
Step 6: Update /etc/hosts in the Kubernetes Prometheus Pod
After configuring the SFM remote write settings, update the /etc/hosts file in the Kubernetes Prometheus pod to ensure proper DNS resolution:
-
Identify the Prometheus pod:
Run on K8s control planekubectl get pods -n telemetry | grep prometheus
-
Access the Prometheus pod:
Run on K8s control planekubectl exec -it -n telemetry <prometheus-pod-name> -- /bin/sh
-
Add the vminsert entry to
/etc/hosts:echo "<vminsert external IP> vminsert-victoria-cluster" >> /etc/hosts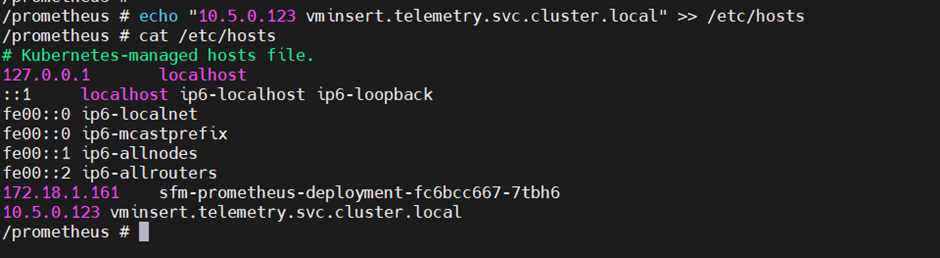
Verification
For detailed SFM telemetry verification steps including VMUI queries and key metrics, see the SFM section in the Setup Telemetry.
Next Steps
- Setup Telemetry -- Overview of all telemetry sources.
Troubleshooting
For common telemetry issues and resolutions, see Troubleshooting Telemetry.