Verify PowerScale Telemetry
This page provides verification steps for the PowerScale telemetry data flow to VictoriaMetrics and VictoriaLogs.
Prerequisites
- The Configure PowerScale Telemetry procedure is complete.
- The service Kubernetes cluster is running with telemetry pods deployed.
Verify PowerScale Telemetry Pods
-
Verify that the VictoriaMetrics pods are running:
Run on K8s control planekubectl get pods -n telemetry -o wide | grep vm
-
Verify that the VictoriaMetrics service is running:
Run on K8s control planekubectl get service -n telemetry -o wide | grep vm
View PowerScale Metrics in VictoriaMetrics UI (VMUI)
Use the VMUI to validate that PowerScale telemetry data is being collected and stored successfully.
-
Note the External IP and port number of the VictoriaMetrics service.
-
Access the VMUI in a web browser:
https://<external vmselect loadbalancer IP>:8481/select/0/vmui -
Filter and view telemetry metrics using queries in VMUI. For example, the following query displays detailed PowerScale metrics for each hardware component:
{__name__=~"powerscale"}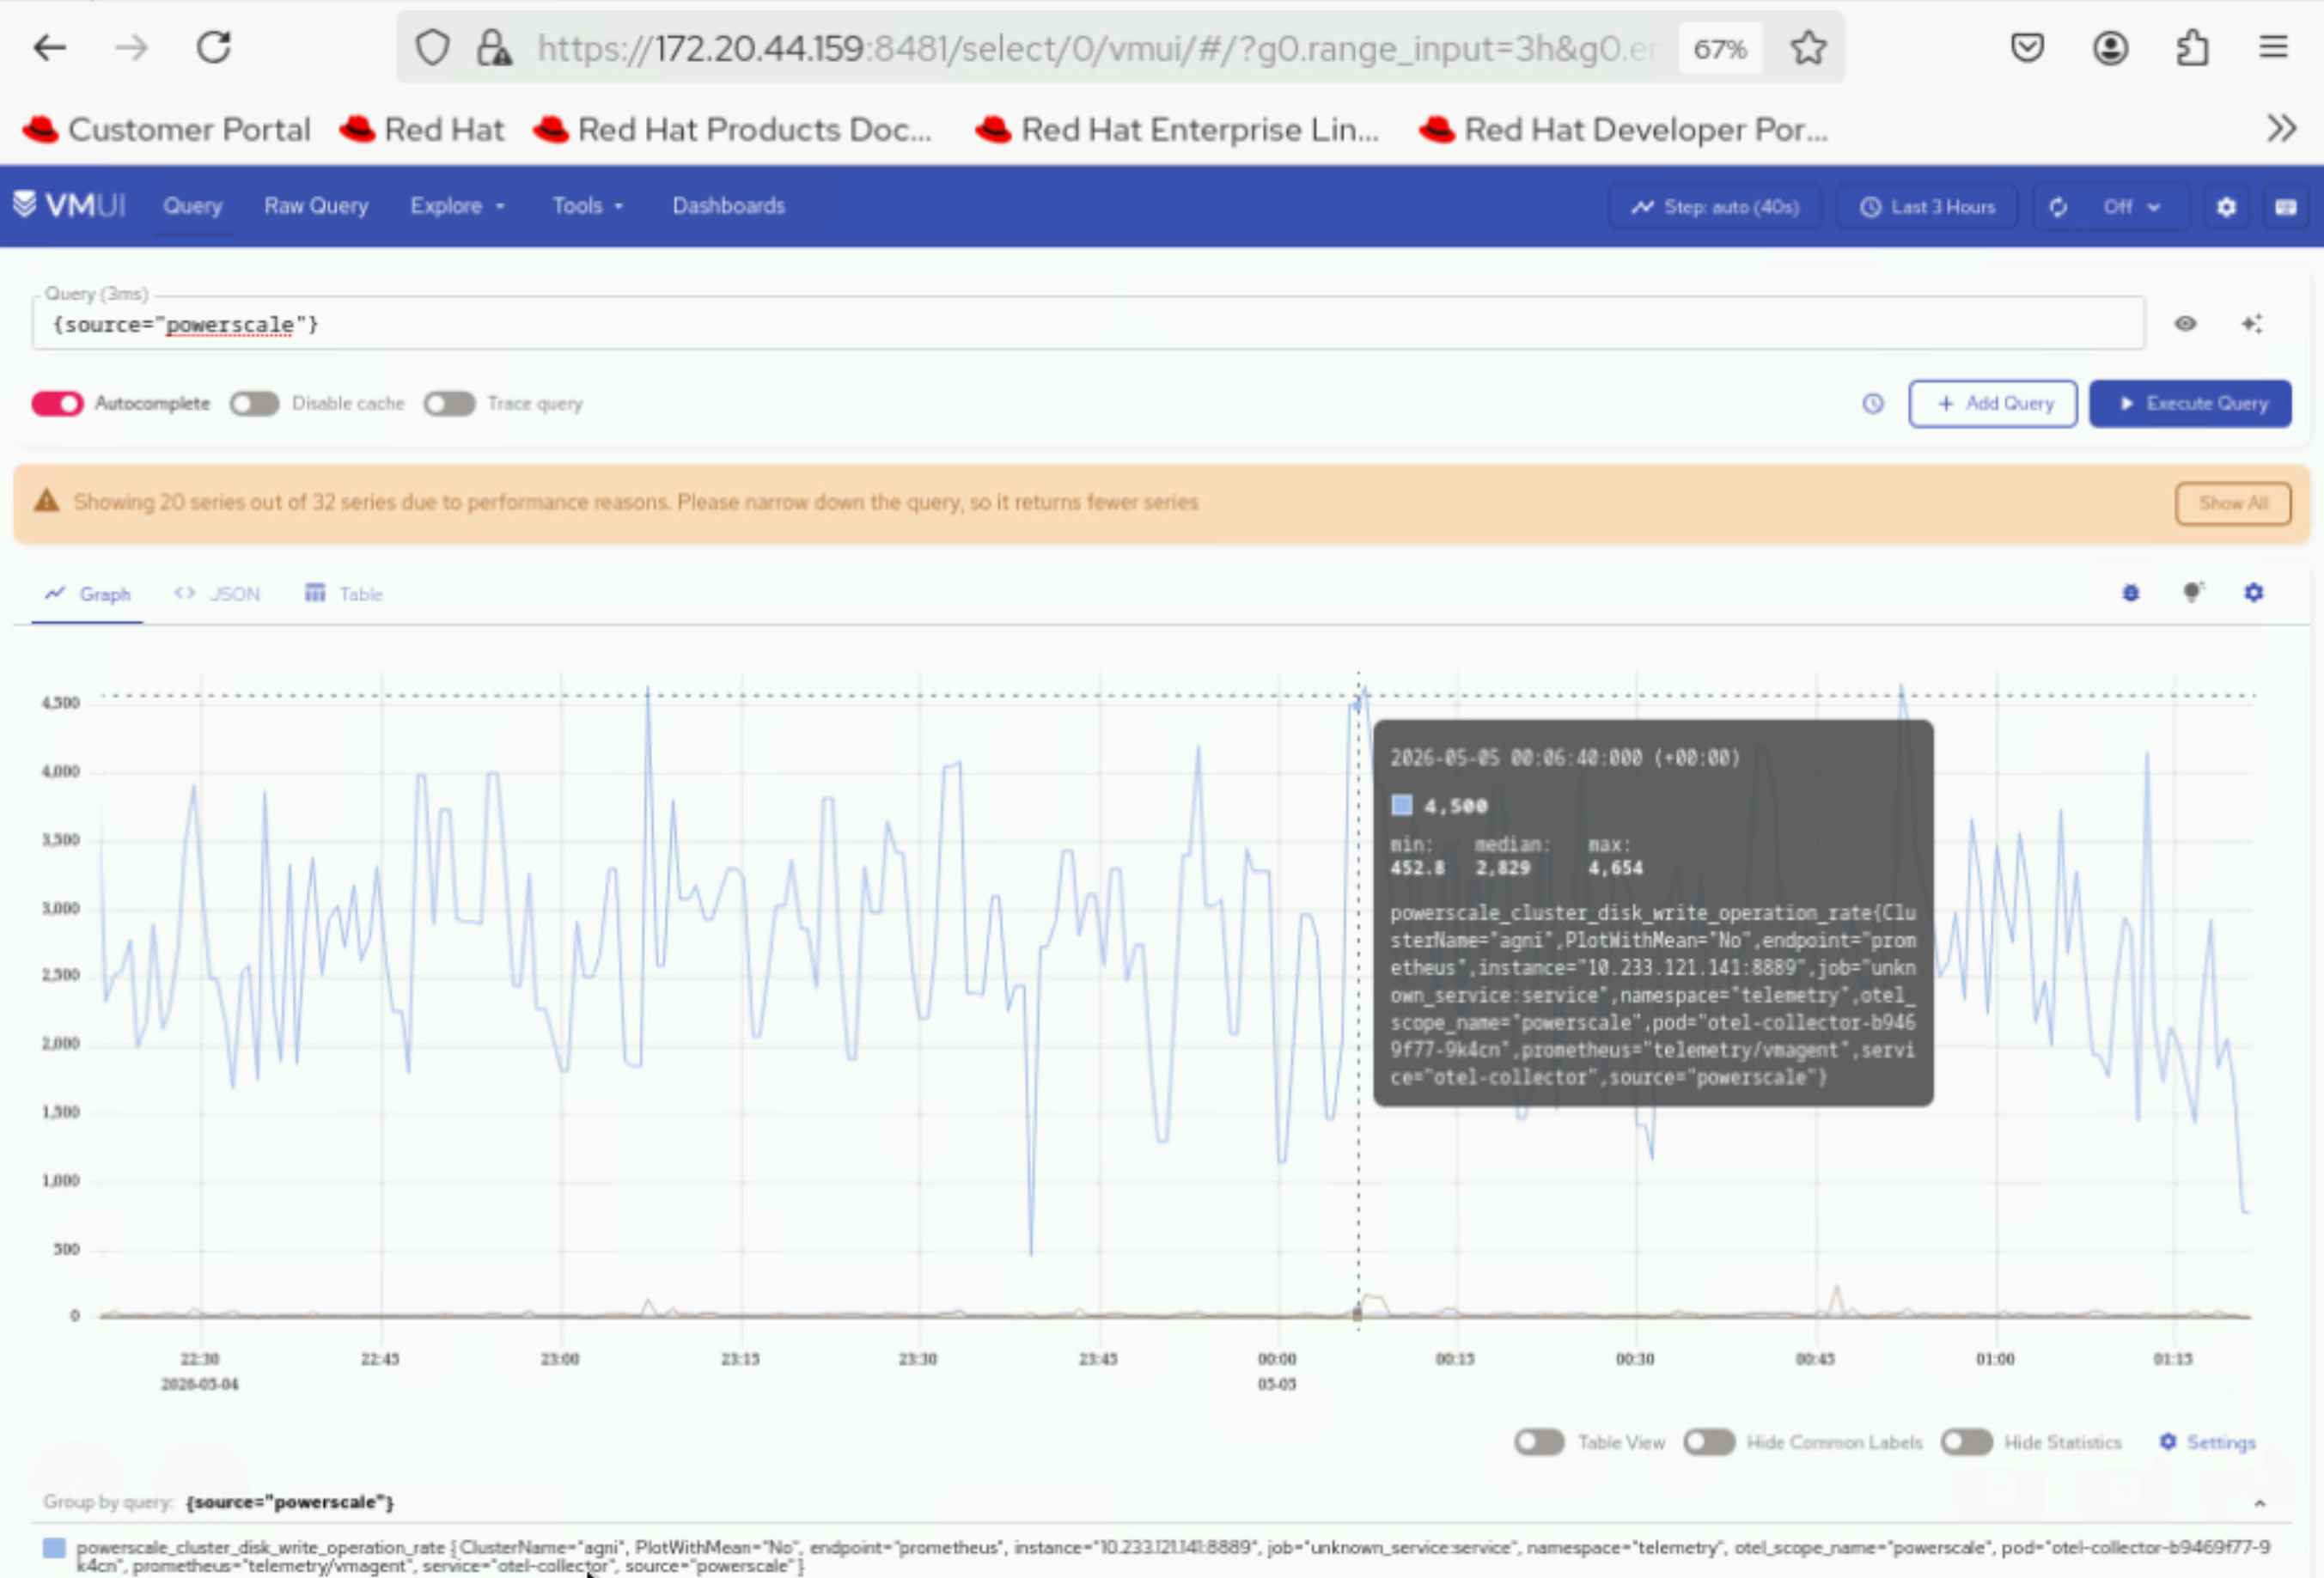
View PowerScale Logs in VictoriaLogs
Use the VictoriaLogs UI to validate that PowerScale log data is being collected.
-
Verify that the VictoriaLogs pods are running:
Run on K8s control planekubectl get pods -n telemetry -o wide | grep vl
-
Verify that the VictoriaLogs service is running:
Run on K8s control planekubectl get service -n telemetry -o wide | grep vl
-
Note the External IP and port number of the VictoriaLogs service.
-
Access the VictoriaLogs UI in a web browser:
https://<external vlselect loadbalancer IP>:9471/select/vmui -
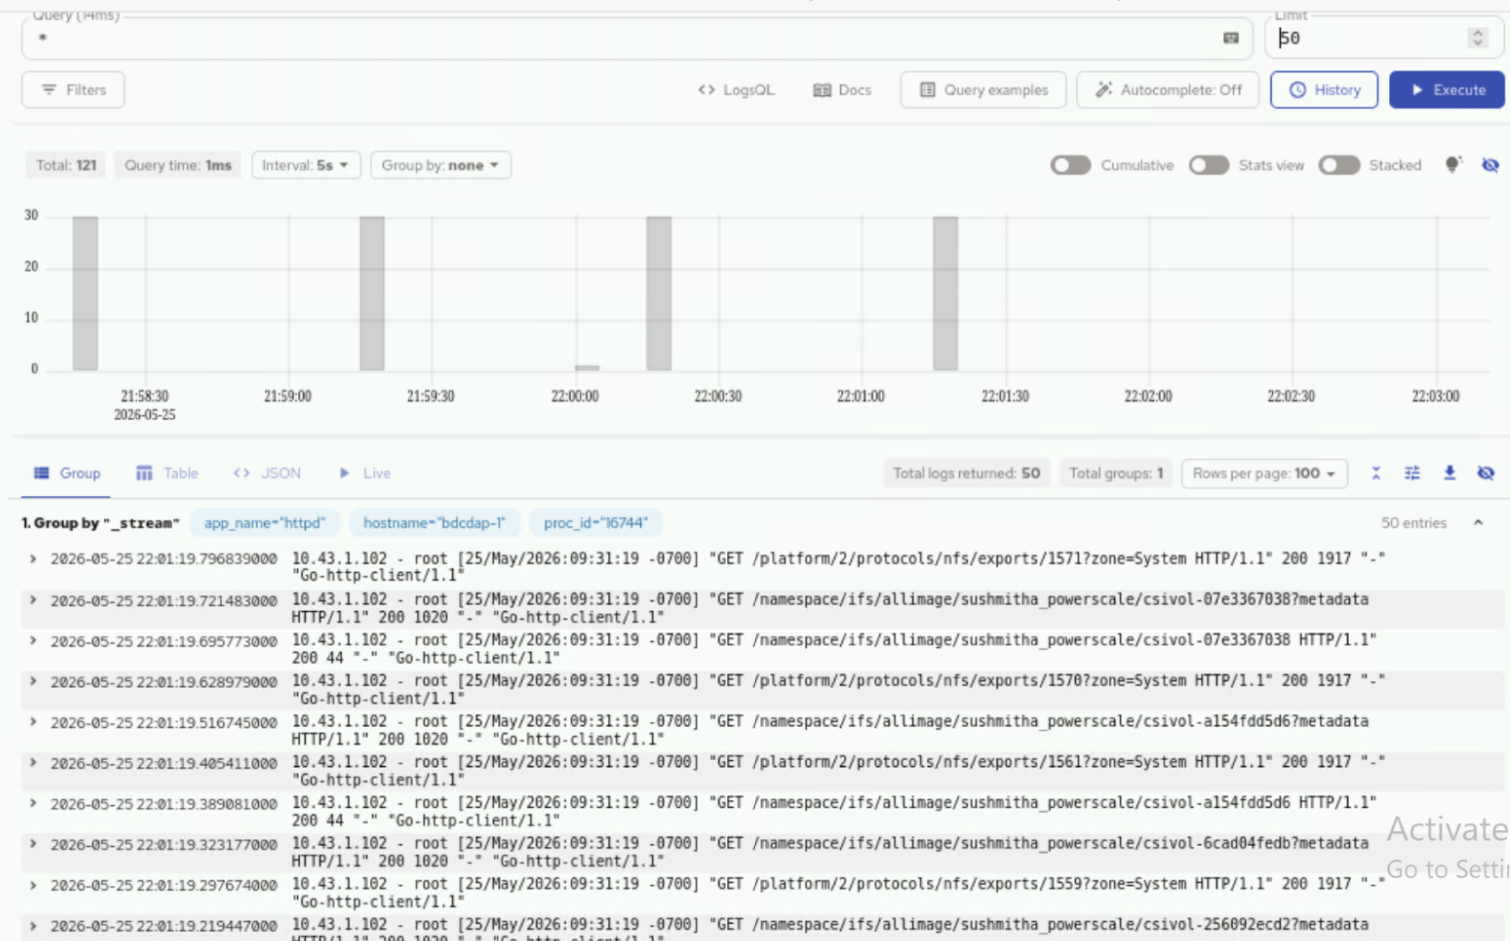
Filter and view PowerScale logs using queries in VictoriaLogs UI. For example, use the
*query to display all logs.