Verify iDRAC Telemetry
This page provides verification steps for the iDRAC telemetry data flow from Kafka to VictoriaMetrics.
Note
For the list of iDRAC telemetry metrics collected by Kafka and VictoriaMetrics, see iDRAC Telemetry Reference Tools.
Prerequisites
- The Configure iDRAC Telemetry procedure is complete.
- The service Kubernetes cluster is running with telemetry pods deployed.
Verify iDRAC Telemetry Pods
-
Verify that the VictoriaMetrics pods are running:
Run on K8s control planekubectl get pods -n telemetry -o wide | grep vm
-
Verify that the VictoriaMetrics service is running:
Run on K8s control planekubectl get service -n telemetry | grep vm
Verify iDRAC Messages in Kafka
To verify that iDRAC telemetry data is being successfully published to the idrac Kafka topic:
-
Log in to the Service Kubernetes control plane.
-
Set the required variables:
Run on K8s control planeKAFKA_LB_IP=<external IP of bridge-bridge-lb service> TOPIC=idrac GROUP=idrac-consumer-group INSTANCE=idrac-consumer-1 -
Create a Kafka consumer:
Run on K8s control planecurl -X POST http://$KAFKA_LB_IP:8080/consumers/idrac-consumer-group \ -H 'content-type: application/vnd.kafka.v2+json' \ -d '{ "name": "idrac-consumer-1", "format": "json", "auto.offset.reset": "earliest" }' -
View the list of iDRAC Kafka topics configured:
Run on K8s control planecurl -s -X GET "http://$KAFKA_LB_IP:8080/topics" | jq '.' -
Subscribe the consumer to the telemetry topic:
Run on K8s control planecurl -X POST http://$KAFKA_LB_IP:8080/consumers/idrac-consumer-group/instances/idrac-consumer-1/subscription \ -H 'content-type: application/vnd.kafka.v2+json' \ -d '{"topics": ["idrac"]}' -
Consume messages from the topic:
Run on K8s control planewhile true; do curl -X GET http://$KAFKA_LB_IP:8080/consumers/idrac-consumer-group/instances/idrac-consumer-1/records \ -H 'accept: application/vnd.kafka.json.v2+json' | jq '.' ; sleep 2; done
If telemetry metrics are collected correctly, the output contains JSON-formatted iDRAC telemetry records.
Verify TLS Connectivity
VictoriaMetrics TLS -- Run the VictoriaMetrics TLS test job:
cd /<nfs client mount path of the service k8s cluster>/telemetry/deployments/test
kubectl apply -f victoria-tls-test-job.yaml
After the job completes, check the logs to confirm that the TLS connection is successful:
kubectl logs victoria-tls-test-xxx -n telemetry
Kafka TLS -- Run the Kafka TLS test job:
cd /<nfs client mount path of the service k8s cluster>/telemetry/deployments/test
kubectl apply -f kafka.tls_test_job.yaml
After the job completes, check the logs to confirm that the TLS connection is successful:
kubectl logs kafka-tls-test-xxx -n telemetry
View iDRAC Metrics in VictoriaMetrics UI (VMUI)
Use the VMUI to validate that iDRAC telemetry data is being collected and stored successfully.
-
Note the External IP and port number of the VictoriaMetrics service.
-
Access the VMUI in a web browser:
https://<external vmselect loadbalancer IP>:8481/select/0/vmui -
Filter and view telemetry metrics using queries in VMUI. For example, the following
PowerEdge_TemperatureReadingquery displays all available metrics: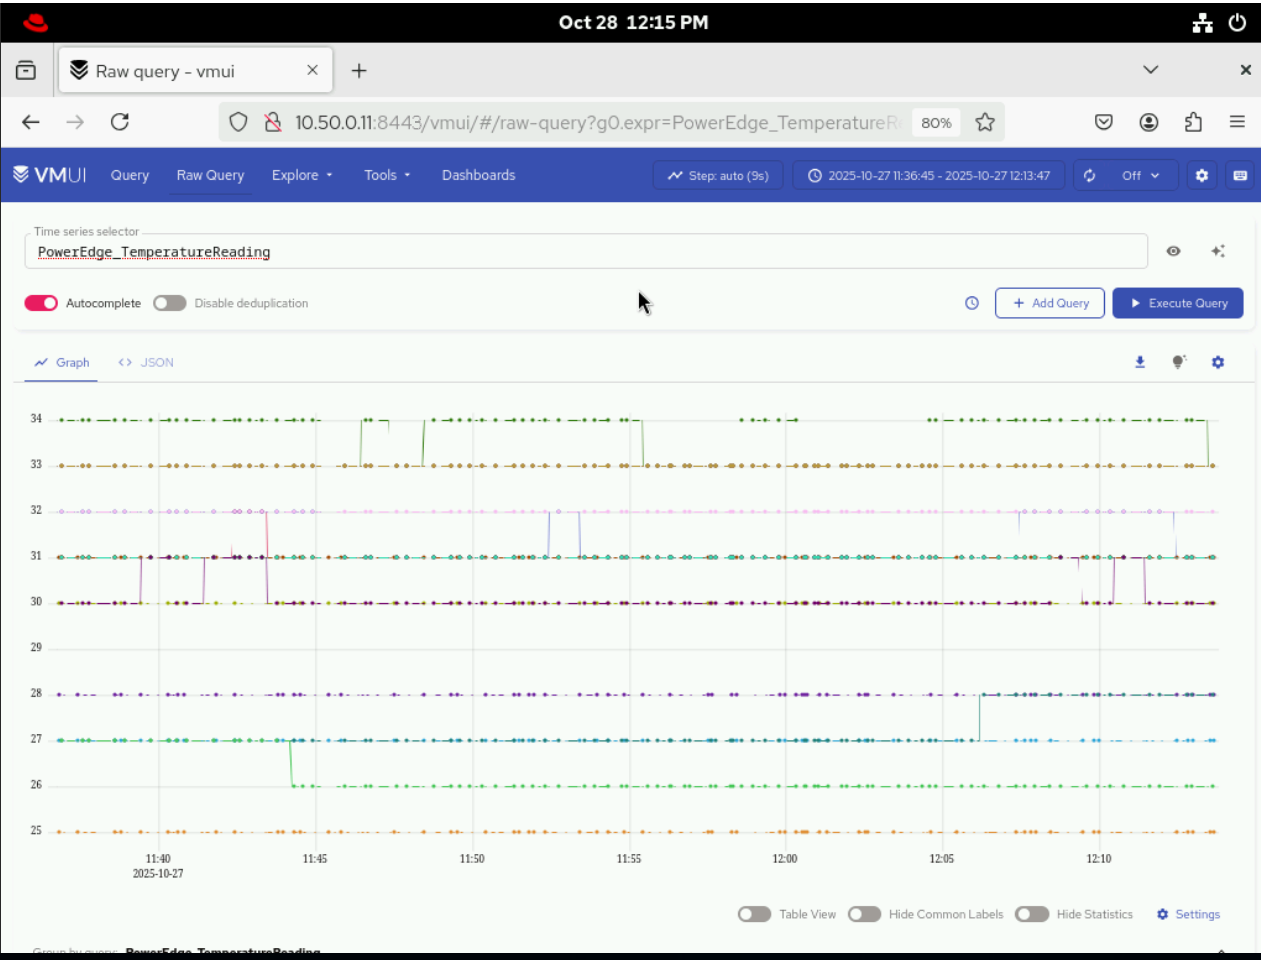
Access the MySQL Database
After telemetry.yml has been executed for the service cluster, you can check the MySQL database inside the mysqldb container.
-
Get the names of all the telemetry pods:
Run on K8s control planekubectl get pods -n telemetry -l app=idrac-telemetryNote
The
idrac-telemetry-0pod will always be responsible for collecting the telemetry data of the management nodes (oim,service_kube_control_plane_x86_64,service_kube_node_x86_64,login_node_x86_64, etc.). -
Execute the following command:
Run on K8s control planekubectl exec -it -n telemetry <iDRAC_telemetry_pod_name> -c mysqldb -- mysql -u <MYSQL_USER> -p -
When prompted, enter the MySQL password to log in.
-
To enter into the
idrac_telemetry_db:use idrac_telemetrydb; -
To access the services table:
select * from services;