Verify SFM Telemetry Flow
View Collected SFM Telemetry Data using VictoriaMetrics UI (VMUI) - Cluster Mode Deployment
To view the SFM telemetry data that is streamed to VictoriaMetrics, do the following:
Run the following command to verify that the VictoriaMetrics pod is running:
kubectl get pods -n telemetry -o wide | grep vm

Run the following command to verify that that all the services of VictoriaMetrics cluster are running:
kubectl get service -n telemetry -o wide | grep vm

Note the External IP and port number of the
vmselectservice. The external IP and port number will be used to access the VictoriaMetrics UI (VMUI).Access the VMUI in a web browser using:
https://<external vmselect loadbalancer IP>:8481/select/0/vmui
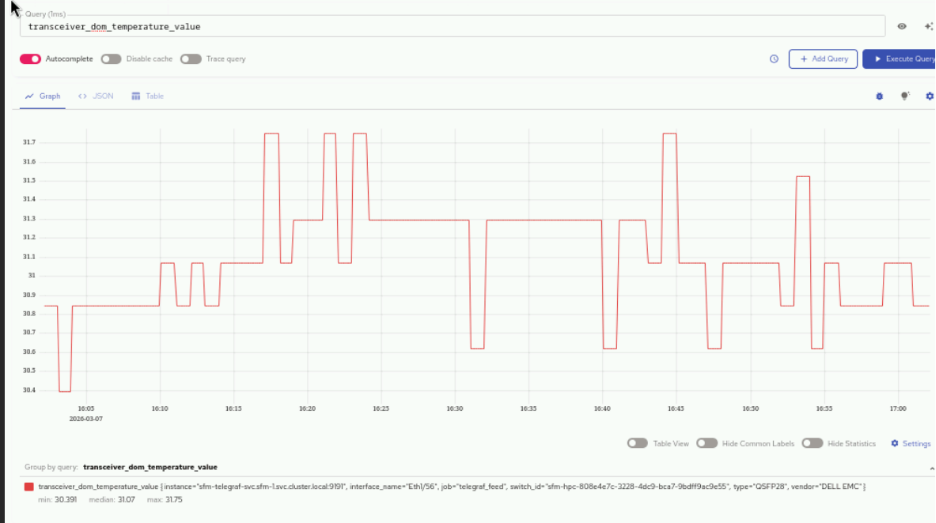
5. Filter and view telemetry metrics using queries in VMUI. For example, the following query displays transceiver DOM temperature values:
transceiver_dom_temperature_value
The following are some of the key metrics that can be queried:
transceiver_dom_temperature_value- Monitors optical transceiver temperature for hardware healthqueue_tx_pkts- Tracks transmitted packets per queue for performance monitoringqueue_drop_pkts- Counts dropped packets per queue to identify congestion issuesqueue_tx_bits_per_second- Measures queue throughput in bits per secondifcounters_in_octets- Monitors incoming data volume in bytes per interfaceifcounters_out_octets- Monitors outgoing data volume in bytes per interfaceifcounters_in_pkts- Counts incoming packets per interfaceifcounters_out_pkts- Counts outgoing packets per interfaceifcounters_in_errors- Tracks input errors per interface for fault detectionifcounters_out_errors- Tracks output errors per interface for fault detection
If you have any feedback about Omnia documentation, please reach out at omnia.readme@dell.com.