Verify OME Telemetry Flow
Verify OME Telemetry Data in Kafka
To verify that OME telemetry data is being successfully published to the OME Kafka topics, do the following:
Note
Ensure that the nodes are discovered in OpenManage Enterprise before configuring telemetry streaming.
Log in to Service Kubernetes Control plane.
Set the required variables using the following command:
KAFKA_LB_IP=<external IP of bridge-bridge-lb service>
TOPIC=<OME Topic Name>
GROUP=ome-consumer-group
INSTANCE=ome-consumer
Create a kafka consumer using the following command:
curl -s -X POST "http://$KAFKA_LB_IP:8080/consumers/$GROUP" \
  -H 'content-type: application/vnd.kafka.v2+json' \
  -d '{"name": "ome-consumer", "format": "json", "auto.offset.reset": "earliest"}'
To view the list of OME Kafka topics configured, use the following command:
curl -s -X GET "http://$KAFKA_LB_IP:8080/topics" | jq '.'
Subscribe the consumer to the telemetry topic using the following command:
curl -s -X POST "http://$KAFKA_LB_IP:8080/consumers/$GROUP/instances/$INSTANCE/subscription" \
  -H 'content-type: application/vnd.kafka.v2+json' \
  -d '{"topics": ["'"$TOPIC'""]}'
Consume messages from the topic using the following command:
while true; do
  curl -s -X GET "http://$KAFKA_LB_IP:8080/consumers/$GROUP/instances/$INSTANCE/records" \
    -H 'accept: application/vnd.kafka.json.v2+json' | jq '.'
  sleep 2
done
(Optional) Cleanup the consumer using the following command:
curl -s -X DELETE "http://$KAFKA_LB_IP:8080/consumers/$GROUP/instances/$INSTANCE"
Note
From beginning: Ensure
"auto.offset.reset": "earliest"when creating the consumer if you want existing data.Message format: Use
"format": "json"only if producers publish JSON. Otherwise use"binary"and decode base64 payloads.Throughput: Adjust polling interval; bridge returns empty array when no new records.
404/409 errors: 404 usually means wrong group/instance name; 409 means already subscribed.
Verify OME Telemetry Data in VictoriaMetrics
To verify that OME telemetry data is being successfully routed from Kafka to VictoriaMetrics using Vector, do the following:
Access the VMUI in a web browser using:
https://<external vmselect loadbalancer IP>:8481/select/0/vmui
Navigate to the Explore tab.
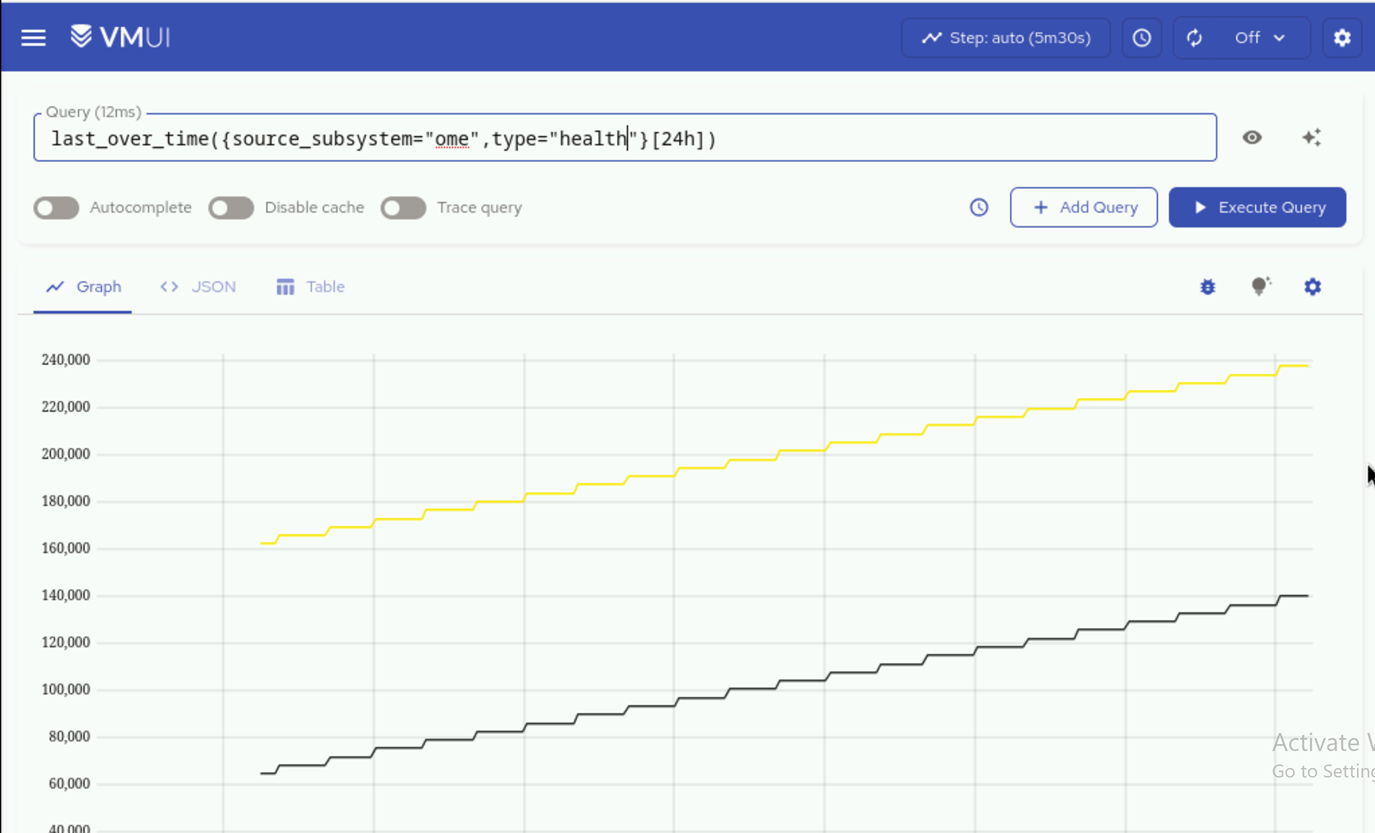
Run the following queriy to retrieve health metrics from OME:
last_over_time({source_subsystem="ome", type="healty"}[24h])
Note
Note that source_subsystem=ome is coming from the ome_identifier that the user has given in the telemetry_config.yml input file and the suffix after the dot (i.e., health, inventory, auditlogs) is coming from OME.
Verify that OME-related metrics are displayed in the results.
Note
Ensure that the Vector-OME bridge is enabled in telemetry_config.yml (telemetry_bridges > vector_ome > metrics_enabled: true) for metrics data to flow from Kafka to VictoriaMetrics.
Verify OME Telemetry Data in VictoriaLogs
To verify that OME telemetry data is being successfully routed from Kafka to VictoriaLogs using Vector, do the following:
Access the VictoriaLogs UI in a web browser using:
https://<external vlselect loadbalancer IP>:9471/select/vmui
Navigate to the Select tab.
In the query field, run the following query to filter for OME logs:
_msg_topic:ome.auditlogs
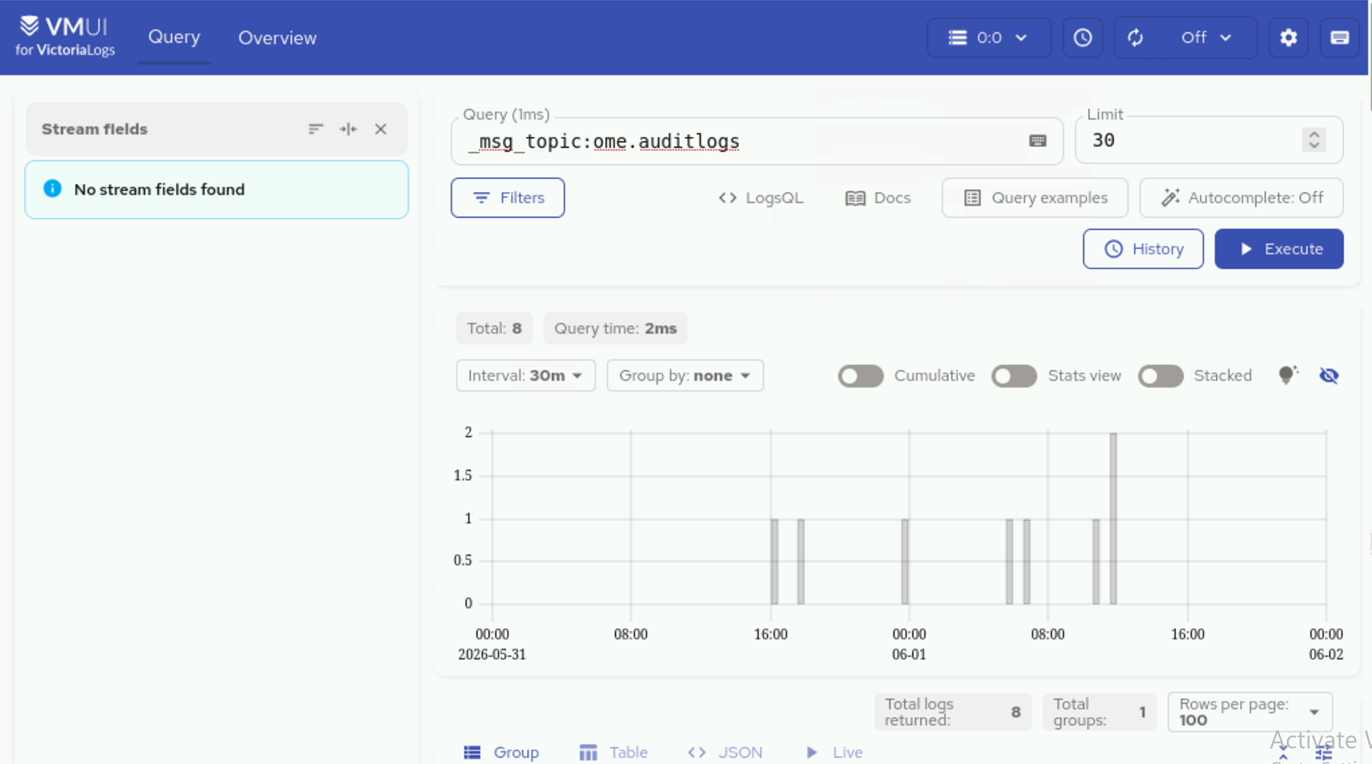
Verify that OME-related logs are displayed in the results.
Note
Ensure that the Vector-OME bridge is enabled in telemetry_config.yml (telemetry_bridges > vector_ome > logs_enabled: true) for logs data to flow from Kafka to VictoriaLogs.
If you have any feedback about Omnia documentation, please reach out at omnia.readme@dell.com.