Troubleshooting Guide
A structured guide for diagnosing and resolving issues across Omnia deployment, provisioning, Kubernetes, Slurm, storage, authentication, and telemetry workflows.
1. Core Container & OIM Issues
Common Container Debugging Tools
Use the following commands to troubleshoot container issues across Omnia services.
View all Omnia containers
podman ps -a
View container logs
podman logs -n 200 <container>
Test outbound connectivity from a container
podman exec -it <container> sh -lc 'curl -I https://example.com'
1.1 Omnia Core Container Fails to Deploy
Symptoms
omnia.shaborts earlypodman pullfailsContainer starts but cannot write to shared path
Causes
Podman pull/auth issues
Time synchronization failure
Invalid OIM hostname
NFS/SELinux permission issues
Resolution
Check container status:
podman ps --format 'table {{.Names}}\t{{.Status}}'
Check logs:
podman logs -n 200 omnia_core
Check time synchronization:
timedatectl status
chronyc tracking || chronyc sources -v
Validate OIM hostname (no dots, underscores, commas, uppercase, leading/trailing hyphens, or leading digits; FQDN ≤64 chars).
Validate NFS mount and SELinux labeling:
podman run --rm -v /shared:/mnt:z registry.access.redhat.com/ubi10/ubi sh -lc 'touch /mnt/.rw'
Re-run omnia.sh.
1.2 Prepare OIM Failures
Symptoms
Certificate or TLS failures
Expected container not created
Service is running but unreachable
Cause
Invalid or expired TLS certificates
Container image pull failures
Network connectivity issues
Incorrect configuration parameters
Resolution
Verify container inventory:
podman ps --format 'table {{.Names}}\t{{.Image}}\t{{.Status}}'
1.3 Ansible Vault Decryption Failures
Symptom
Playbook execution fails with error message “Attempting to decrypt but no vault secrets found” or similar vault decryption errors.
Cause
The vault password file (.omnia_config_credentials_key) is missing, incorrect, or inaccessible to the playbook execution context.
Resolution
Verify the vault password file exists in the correct location:
.omnia_config_credentials_keyEnsure the file has the correct permissions (readable by the user running the playbook)
Re-run the playbook with the correct vault password file
For information on managing encrypted parameters, see Encrypted Parameters Management
1.4 OIM Cleanup NFS Directory Deletion Failure
Symptoms
oim_cleanup.ymlplaybook fails with error:[ERROR]: Task failed: Module failed: rmtree failed: [Errno 39] Directory not emptySpecific error on directories like
/share_omnia_k8s/<node_ip>/kubelet/podsCleanup process completes partially but leaves NFS share directories intact
Example Error
[ERROR]: Task failed: Module failed: rmtree failed: [Errno 39] Directory not empty: '/share_omnia_k8s/10.20.0.15/kubelet/pods'

failed: [oim] (item=/share_omnia_k8s/10.20.0.15) => {
  "ansible_loop_var": "item",
  "changed": false,
  "item": "/share_omnia_k8s/10.20.0.15",
  "msg": "rmtree failed: [Errno 39] Directory not empty: '/share_omnia_k8s/10.20.0.15/kubelet/pods'"
}
Cause
Active processes - Kubernetes processes (kubelet, crio) on compute nodes or OIM node have open file handles to the NFS share directories
Active NFS mounts - NFS shares are still mounted and in use on compute nodes
Note
The OIM cleanup process cleans the contents of NFS shares for both Slurm and Kubernetes (K8s). Active processes or mounts may prevent successful cleanup.
Resolution
Step 1: Manually delete the problematic directories on the OIM node
Log in to the OIM node and navigate to the NFS share path to manually delete the contents:
# On the OIM node
# Navigate to the problematic directory
cd /share_omnia_k8s/<node_ip>/kubelet/pods

# Delete all contents
rm -rf *

# Or delete the entire node directory
cd /share_omnia_k8s/
rm -rf <node_ip>
Step 2: Re-run the OIM cleanup playbook from the omnia_core container
After manually deleting the problematic directories, log in to the omnia_core container and re-run the cleanup playbook:
# Log in to omnia_core container
ssh omnia_core

# Navigate to utils directory
cd /omnia/utils

# Re-run the cleanup playbook
ansible-playbook oim_cleanup.yml
Tip
If manual deletion also fails with “Directory not empty” or “Device or resource busy” errors, the directories are still in use by active processes. In such cases, power off the compute nodes before attempting manual cleanup.
2. PXE Boot & Provisioning Issues
2.1 Node Hangs at nm-wait-online-initrd.service
Symptom
Node hangs during boot at the nm-wait-online-initrd.service stage.
Cause
IP address conflict with old node.
Resolution
Ensure old node is powered off/disconnected
Verify IP address is unused
Re-run
provision.yml
2.2 PXE Boot Timeout (TFTP/Service Timeout)
Symptom
PXE boot process times out with TFTP or service timeout errors.
Cause
PXE NIC not configured
Extra NIC interfering
Multiple PXE servers
Resolution
Configure BIOS → Network Settings → PXE Device
Assign correct active NIC
Remove/add NIC only after boot completion
2.3 Target Server Unreachable After PXE Boot
Symptom
Target server becomes unreachable after PXE boot completes.
Cause
POST errors
F1 hardware prompts
Boot stalls
Resolution
Log in to iDRAC
Clear errors or disable POST
Hard reboot
Disable PXE temporarily if needed
2.4 Root Login Fails
Symptom
Unable to log in as root user via SSH. Error messages include:
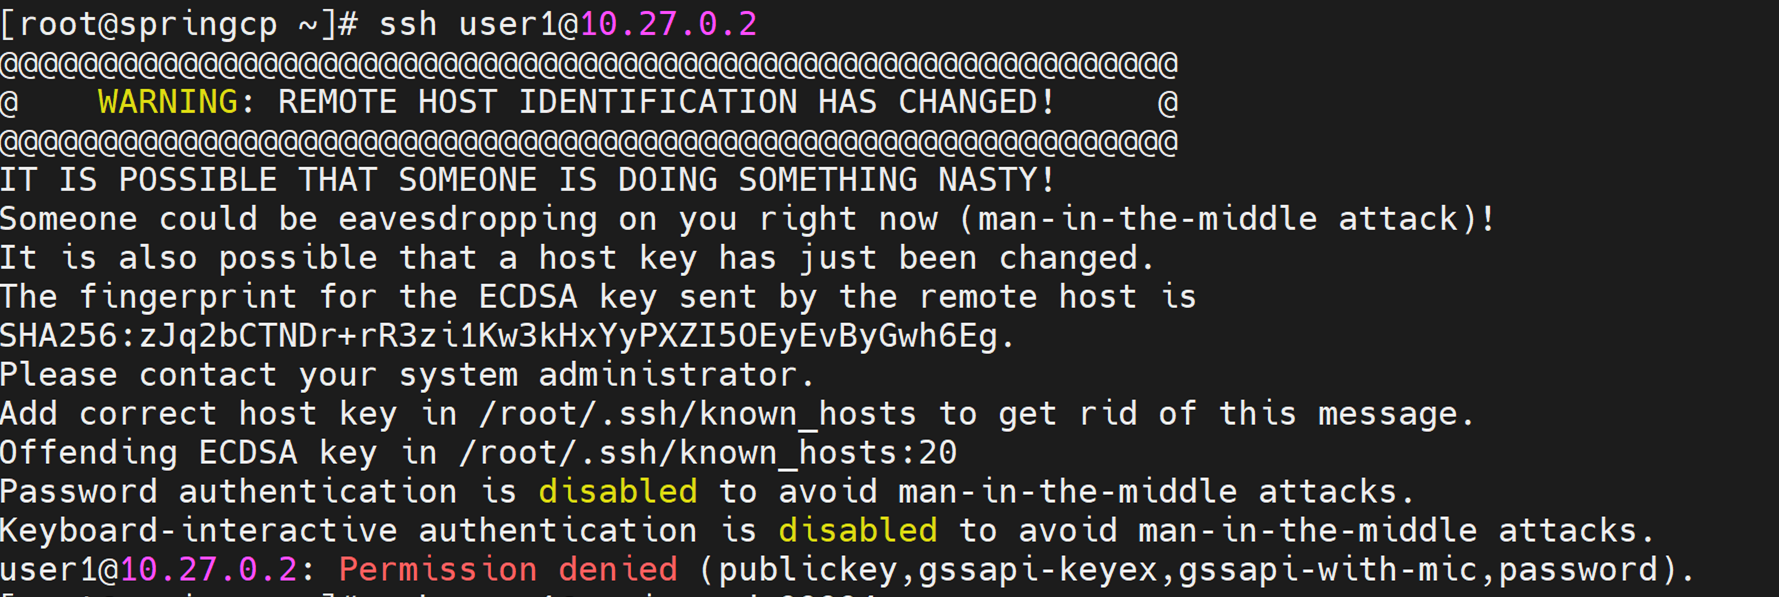
WARNING: REMOTE HOST IDENTIFICATION HAS CHANGED!Permission denied (publickey,gssapi-keyex,gssapi-with-mic)ssh: connect to host <ip> port 22: Connection refused
Cause
Outdated SSH key
cloud-init not rendered
Resolution
ssh-keygen -R <hostname>
Retry login or reprovision the node.
3. Local Repository & Pulp Issues
3.1 local_repo.yml Download Failures
Symptom
The local_repo.yml playbook fails during package download, displaying errors such as “TASK [parse_and_download : Display Failed Packages]” or indicating that specific software packages could not be downloaded.
Cause
Download failures occur due to:
Incorrect URLs in software JSON configuration files
Docker pull limit reached or invalid Docker credentials
Insufficient disk space on Pulp NFS storage
Unreachable software repositories
Resolution
Verify and correct URLs in the software JSON configuration files
Provide valid Docker credentials in
input/omnia_config_credentials.ymlEnsure adequate disk space is available on Pulp NFS storage
Re-run the
local_repo.ymlplaybook
Detailed Log Analysis
The local_repo.yml playbook generates log files for troubleshooting download failures. To diagnose specific issues:
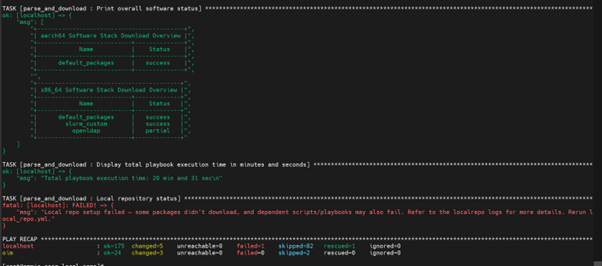
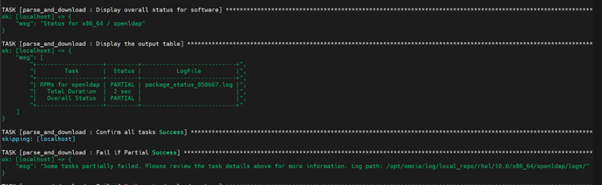
View overall download status of all software:
/opt/omnia/log/local_repo/<cluster_os>/<cluster_os_version>/<arch>/software.csv
Example:
/opt/omnia/log/local_repo/rhel/10.0/x86_64/software.csv

View download status and log filenames for a specific software:
/opt/omnia/log/local_repo/rhel/10.0/x86_64/<sw>_task_results.log
Example for OpenLDAP:
/opt/omnia/log/local_repo/rhel/10.0/x86_64/openldap_task_results.log

View package-level status for a specific software:
/opt/omnia/log/local_repo/<cluster_os>/<cluster_os_version>/<arch>/<sw>/status.csv
Example:
/opt/omnia/log/local_repo/rhel/10.0/x86_64/openldap/status.csv

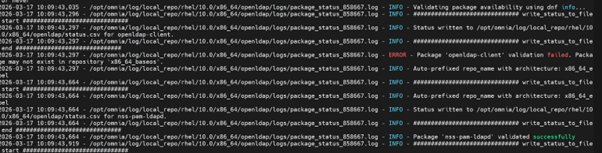
View detailed failure information in the package status log:
To view the issues information and the reason for job being unsuccessful, see the
package_status_<pid>.logfile mentioned in the<sw>_task_result.log.Example:
/opt/omnia/log/local_repo/rhel/10.0/x86_64/openldap/logs/package_status_62982.log
If the local_repo.yml is executed successfully without any package download failures, a Successful message is displayed.

3.2 Pulp Reset Password Failed
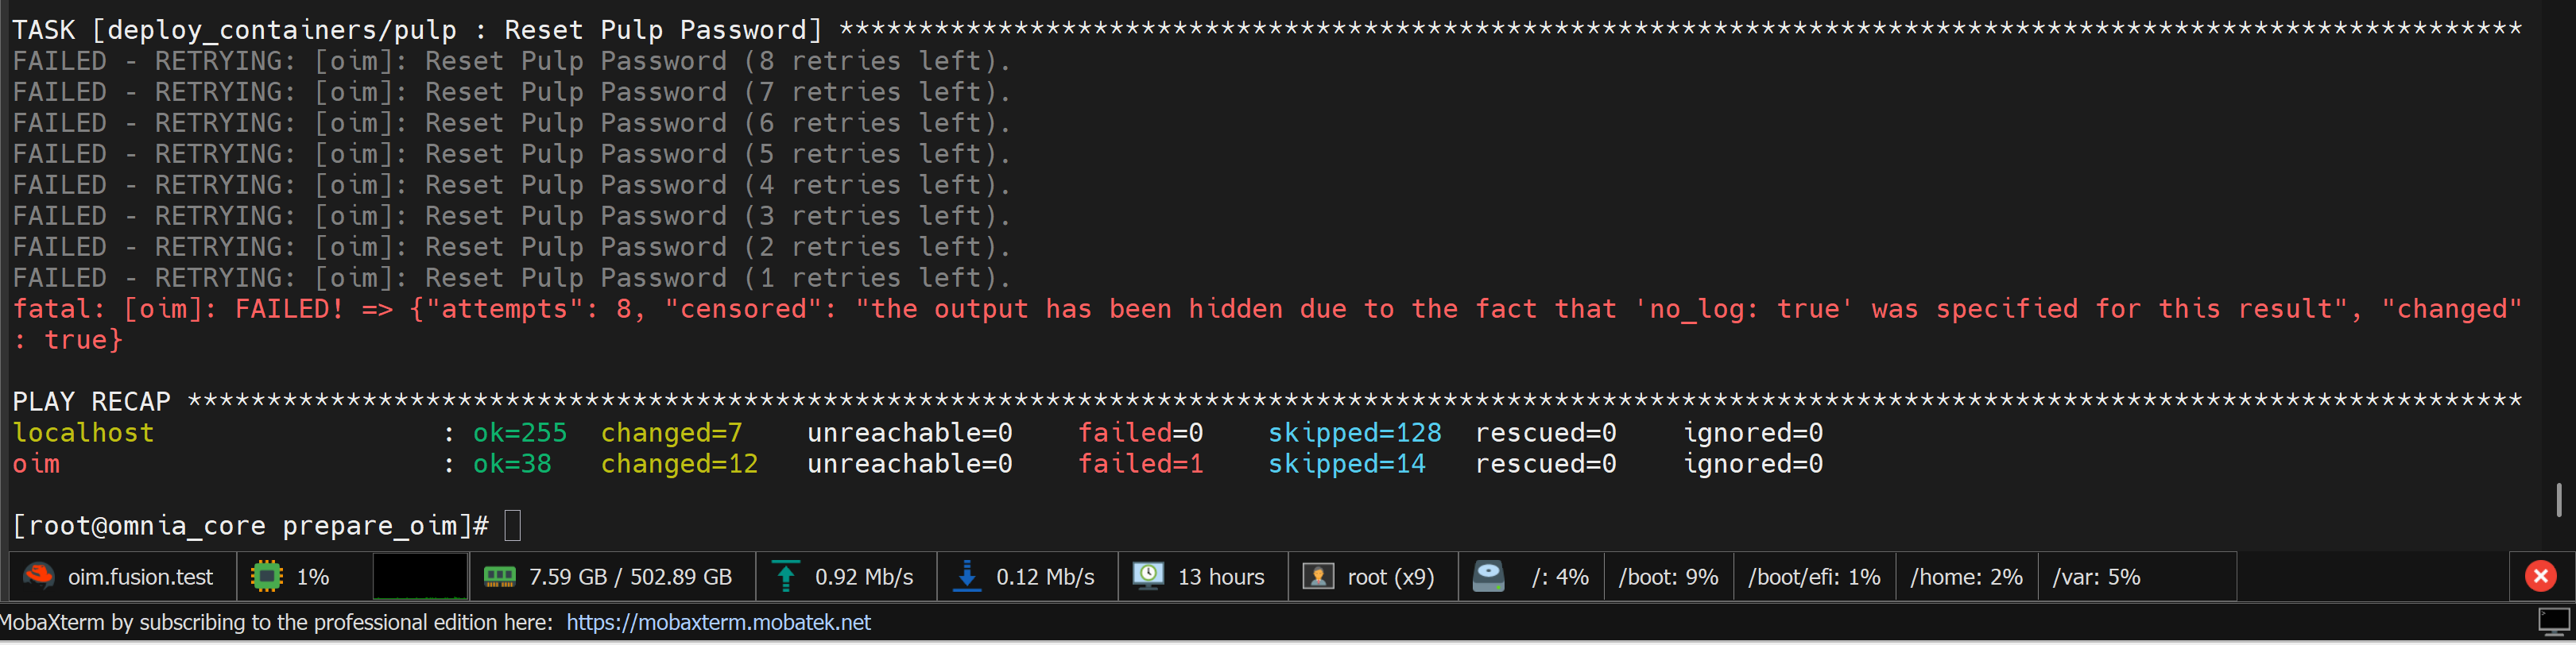
Symptom
Pulp reset password operation fails during prepare_oim.yml execution.
Cause
NFS Storage Export Configuration (PowerScale): Missing or incorrect settings for
nfsv4-no-names,nfsv4-no-domain,nfsv4-no-domain-uids, andnfsv4-allow-numeric-idsInconsistent UID and GID mappings between NFS server and client
Access Permissions: Missing
no_root_squashoption in NFS export configurationNetwork Reachability: NFS server connectivity issues or firewall blocking ports 2049, 111, and 20048
Resolution
Verify the configurations and settings mentioned above, then rerun the prepare_oim.yml playbook. For PowerScale-specific configuration details, see the PowerScale configuration page in the Omnia Deployment Requirements documentation.
3.4 Intermittent Local Repository Sync Failures
Symptom
Local repository synchronization fails intermittently, particularly after an OIM restart or firewall reload. The OIM may have internet access while the repository container cannot reach external repositories.
Cause
Required outbound traffic from the Podman container network is blocked by the OIM firewall. Temporary firewall rules may also be lost after a restart or firewall reload.
Warning
Do not set the INPUT, FORWARD, or OUTPUT policies to ACCEPT:
iptables -P INPUT ACCEPT
iptables -P FORWARD ACCEPT
iptables -P OUTPUT ACCEPT
These commands effectively bypass the OIM firewall policy and may expose the system to unauthorized traffic.
Resolution
Identify the repository container and Podman network:
podman ps -a
podman network ls
podman network inspect <network_name>
Verify connectivity from the affected container:
podman exec <container_name> getent hosts <repository_fqdn>
podman exec <container_name> curl -Iv --connect-timeout 10 https://<repository_fqdn>/
Review the active forwarding rules:
iptables -L FORWARD -n -v --line-numbers
Add narrowly scoped rules. Replace the placeholders with values from your environment:
# Allow established return traffic
iptables -I FORWARD 1 \
  -d <container_subnet> \
  -m conntrack --ctstate ESTABLISHED,RELATED \
  -j ACCEPT

# Allow container DNS queries
iptables -I FORWARD 1 \
  -s <container_subnet> -d <dns_server_ip> \
  -p udp --dport 53 \
  -m conntrack --ctstate NEW,ESTABLISHED \
  -j ACCEPT

# Allow HTTPS only to the approved repository or proxy
iptables -I FORWARD 1 \
  -s <container_subnet> -d <repository_or_proxy_cidr> \
  -p tcp --dport 443 \
  -m conntrack --ctstate NEW,ESTABLISHED \
  -j ACCEPT
Add TCP port 80 only if the repository explicitly requires HTTP.
Retest repository access:
podman exec <container_name> curl -Iv --connect-timeout 10 https://<repository_fqdn>/
Make the scoped rules persistent using the firewall manager configured on the OIM, such as firewalld or nftables.
Note
For repositories using CDNs or frequently changing IP addresses, route container traffic through an approved outbound proxy and restrict access to the proxy IP and port. Do not create broad internet-access rules.
Validation
Confirm that: - Repository synchronization completes successfully - The scoped rules remain after an OIM restart or firewall reload - Default firewall policies have not been changed to blanket ACCEPT - No unnecessary inbound or forwarded access has been enabled
3.5 Connectivity Issues
Symptom
local_repo.yml fails with connectivity errors. Failures can occur at multiple stages:
Validation stage: URL reachability checks fail with “<url> is either unreachable, invalid or has incorrect SSL certificates” or “Unreachable registries detected: <host>”
Pulp sync stage: Repository sync to the local Pulp server fails or times out
Download stage: Package downloads fail with “Download interrupted”, “Max retries exceeded, download failed”, or “Unable to reach Docker Hub (network DNS/timeout/SSL issue)”
Final status reports: “Local repo setup failed — some packages didn’t download, and dependent scripts/playbooks may also fail. Refer to the localrepo logs for more details. Rerun local_repo.yml.”
Cause
The OIM was unable to reach a required online resource. Specific causes include:
External repository URLs are unreachable due to network outage, DNS failure or firewall rules.
local_repo.ymlplaybook fails fast on the first unreachable URL before testing all URLs and reporting all failures.User-defined registries or repository URLs in
local_repo_config.ymlare unreachableSSL/TLS certificate issues — mismatched, expired, or missing certificates for user repositories or registries
Docker Hub rate limiting (HTTP 429), invalid credentials (HTTP 401), or server errors (HTTP 5xx)
Pulp container is not running or Pulp endpoint is unresponsive
Resolution
Verify connectivity to the upstream repository URLs configured in ``local_repo_config.yml``
Verify that the Pulp container is running and Pulp endpoint is accessible:
podman ps | grep pulp
curl -k https://<pulp_server_ip>:<pulp_port>/pulp/api/v3/status/
If user registries are configured, verify connectivity on the OIM
Check the logs for specific error messages:
grep -i "unreachable" /opt/omnia/log/core/playbooks/local_repo.log
grep -RiE "unreachable|timeout|connection|failed|SSL" /opt/omnia/log/local_repo/standard.log
grep -RiE "Download interrupted|Max retries exceeded|HTTP error" /opt/omnia/log/local_repo/rhel/10.0/x86_64/*/logs/
Apply the appropriate recovery:
If the Pulp container is not running, run
prepare_oim.ymlfirst.If external URLs are unreachable, verify DNS resolution, and firewall rules on OIM.
If SSL certificate errors occur for user repos, verify that certificate files exist under the expected path and are valid.
If Docker Hub rate limiting occurs, wait and retry, or configure Docker Hub credentials in
omnia_config_credentials.yml.
Rerun ``local_repo.yml`` after resolving the connectivity issues. Previously downloaded packages are not re-downloaded.
3.6 Software Installation Fails with Checksum Error
Symptom
Software installation fails with a checksum error.
Cause
A local repository for the software has not been configured by the local_repo.yml playbook.
Resolution
Re-run the
local_repo.ymlplaybook with proper inputs to download the software package to the Pulp repository.Once the local repository has been configured successfully, re-run the failed installation script.
3.8 Pulp Certificate Trust Failure on Compute Nodes
Symptoms
dnf installfails with SSL certificate errors on provisioned compute nodesPackage installation during cloud-init
runcmdphase failsContainer image pulls from the Pulp mirror fail on nodes
Example errors
On the compute node:
SSL certificate problem: unable to get local issuer certificate
Peer's certificate issuer is not recognized
Error: Failed to download metadata for repo 'pulp_mirror'
Cause
The Pulp webserver certificate (pulp_webserver.crt) was not copied or trusted on the node. All cloud-init templates include a runcmd step that copies the certificate from the NFS-mounted /cert directory:
cp /cert/pulp_webserver.crt /etc/pki/ca-trust/source/anchors && update-ca-trust
This step can fail if the NFS mount for /cert was not established before the certificate copy step executes.
Diagnostics
# Check if the certificate is present and trusted
ls -la /etc/pki/ca-trust/source/anchors/pulp_webserver.crt
ls -la /cert/pulp_webserver.crt

# Verify the NFS mount for /cert
mount | grep /cert

# Test SSL connectivity to Pulp
openssl s_client -connect <admin_nic_ip>:2225 -showcerts </dev/null 2>&1 | grep -i verify

# Test package manager connectivity
dnf repolist
Resolution
Mount the certificate NFS share and copy the certificate manually:
mount | grep /cert || mount -t nfs <admin_nic_ip>:<share_path>/cert /cert
cp /cert/pulp_webserver.crt /etc/pki/ca-trust/source/anchors/
update-ca-trust
Verify package manager connectivity:
dnf repolist
dnf makecache
If the issue recurs on re-provisioned nodes, verify the NFS export for the
/certdirectory is accessible from the node network.
3.9 Container Image Pull Fails from Pulp Mirror
Symptoms
Container images (SIF format) fail to download on Slurm/HPC nodes
/var/log/apptainer_pull.logshows pull failuresExpected container images are missing under
/hpc_tools/container_images
Example errors
In /var/log/container_image_download.log or /var/log/apptainer_pull.log:
[ERROR] Failed to pull container image from Pulp mirror (exit code: 1).
[INFO] Image may not be available in Pulp or download was interrupted.
Error: error pulling image: unable to pull <image>: Error initializing source
TIMEOUT: Container image pull timed out after 1800 seconds
Cause
Container image was not synced to Pulp during
local_repo.ymlexecutionPulp mirror endpoint is unreachable from the node (firewall, network issues)
Pulp certificate not trusted on the node (see Section 3.8)
Image tag mismatch between
container_image.listand what is available in Pulp
Diagnostics
# Check download log
tail -50 /var/log/container_image_download.log
tail -50 /var/log/apptainer_pull.log

# Check if Pulp mirror is reachable from the node
curl -sk https://<admin_nic_ip>:2225/v2/_catalog

# Check what images are expected
cat /hpc_tools/scripts/container_image.list

# Check downloaded images
ls -lh /hpc_tools/container_images/
Resolution
Verify the container image exists in Pulp. From the OIM:
podman exec -it omnia_core pulp container repository list
If the image is missing in Pulp, ensure it is listed in
software_config.jsonand re-runlocal_repo.yml.If the image exists in Pulp but the pull fails, verify certificate trust (Section 3.8) and re-run the download script:
/hpc_tools/scripts/download_container_image.sh
4. Kubernetes Cluster & Pod Issues
4.1 ImagePullBackOff / ErrImagePull
Symptoms
Pods fail to start with
ImagePullBackOfforErrImagePullstatusContainer images cannot be pulled from the local repository
Pod events show image pull errors
Causes
Docker rate limits
Local repo missing images
Resolution
Add Docker Credentials to
omnia_config_credentials.ymlEnsure
local_repo.ymlsucceeded
For more information, click here
4.2 Pods Not in Running State
Symptom
Kubernetes pods are not in a healthy state and remain in Pending, CrashLoopBackOff, ImagePullBackOff, ErrImagePull, or OOMKilled status.
Cause
The pod may be affected by insufficient resources, image pull failures, unavailable storage, invalid configuration, or an unhealthy dependent service.
Resolution
Identify the pod and collect diagnostic information:
kubectl get pods -A -o wide
kubectl describe pod <pod_name> -n <namespace>
kubectl logs <pod_name> -n <namespace> --all-containers
kubectl logs <pod_name> -n <namespace> --all-containers --previous
Resolve the reported condition:
Pending: Check node readiness, scheduling events, resource availability, and PVC status.
kubectl get nodes
kubectl get pvc -n <namespace>
For storage-dependent Omnia pods, verify NFS or PowerScale availability.
CrashLoopBackOff: Review current and previous logs. Verify ConfigMaps, Secrets, PVC mounts, DNS, certificates, and dependent Omnia services.
ImagePullBackOff or ErrImagePull: Verify the image name and tag, node access to the Pulp registry, and registry certificate trust. See Section 4.1 ImagePullBackOff / ErrImagePull.
OOMKilled: Check container memory usage and limits:
kubectl top pod <pod_name> -n <namespace> --containers
After correcting the root cause, restart the controller-managed workload:
kubectl rollout restart deployment/<deployment_name> -n <namespace>
kubectl rollout status deployment/<deployment_name> -n <namespace>
Validation
kubectl get pods -n <namespace> -o wide
kubectl get events -n <namespace> --sort-by=.metadata.creationTimestamp
Confirm that the pod becomes ready, restart counts stop increasing, PVCs remain Bound, and no new warning events appear.
4.3 Cluster Nodes Reboot
Symptom
Cluster nodes reboot unexpectedly or remain NotReady after restarting.
Cause
Possible causes include power or hardware faults, kernel panic, out-of-memory events, automated updates, or failure of Kubernetes, network, or storage services.
Resolution
Check the node and affected pods:
kubectl get nodes -o wide
kubectl describe node <node_name>
kubectl get pods -A -o wide --field-selector spec.nodeName=<node_name>
On the affected node, identify the reboot cause:
last -x | head
journalctl -b -1 -p warning..alert --no-pager
journalctl -k -b -1 --no-pager
Verify node services and Omnia dependencies:
systemctl --failed
systemctl status crio kubelet --no-pager
Also verify network connectivity, time synchronization, and required NFS or PowerScale mounts.
After correcting the root cause, restart only the failed services:
systemctl restart crio kubelet
Caution
Do not repeatedly reboot or reprovision the node before collecting the previous boot logs. Waiting alone does not resolve recurring hardware, kernel, memory, network, or storage failures.
Validation
kubectl get nodes
kubectl get pods -A -o wide
Confirm that the node returns to Ready, its pods recover, and required storage mounts are accessible.
4.4 DNS Unresponsive / CoreDNS Issues
Symptom
DNS resolution fails or CoreDNS is unresponsive in the cluster.
Cause
CoreDNS pod not running
DNS configuration errors
Network connectivity issues
Resolution
Restart CoreDNS:
kubectl rollout restart deployment coredns -n kube-system
4.5 PowerScale SmartConnect DNS Resolution Issues
Symptom
DNS resolution fails for PowerScale SmartConnect zone entries.
Cause
CoreDNS unaware of external SmartConnect zone.
Resolution
Edit ConfigMap:
kubectl -n kube-system edit configmap coredns
Add a hosts block:
hosts {
10.x.x.x management.ps.com
fallthrough
}
Restart CoreDNS.
4.6 Control-plane Join Fails Due to Certificate Key Expiry
Symptom
Control-plane node fails to join the cluster due to certificate key expiry.
Cause
The kubeadm certificate key expires after approximately 2 hours, preventing new control-plane nodes from joining the cluster.
Resolution
On a healthy control-plane node, generate a new control-plane join command:
{{ k8s_client_mount_path }}/generate-control-plane-join.sh
Note
k8s_client_mount_path is the mount_point specified in storage_config.yml for the NFS mount whose name matches the nfs_storage_name defined in the service_k8s_cluster section of omnia_config.yml.
For example, if nfs_storage_name: "nfs_k8s" in omnia_config.yml, and in storage_config.yml the mount named nfs_k8s has mount_point: "/opt/omnia/k8s_mount", then the command would be:
/opt/omnia/k8s_mount/generate-control-plane-join.sh
Reboot the failed control-plane node to rejoin the cluster with the new certificate key.
4.7 Static Pods Show Stale “Running” State After Node Shutdown or Reboot
Symptoms
After a control plane node is powered off, shut down, or rebooted (using systemctl poweroff, poweroff, or systemctl reboot), static pods on the affected node may intermittently show:
Pod STATUS column:
1/1 Running(appears healthy)Pod Phase:
Running(incorrect - should beFailed)Pod Ready Condition:
TrueorFalse(varies)Container State:
running(stale/incorrect - should beterminated)
This is most commonly observed with kube-apiserver pods, but can affect all static pods (etcd, kube-controller-manager, kube-scheduler, kube-vip).
Note
This is an intermittent issue caused by a race condition. The behavior varies depending on timing - sometimes all pods show correct “Failed/Terminated” status, sometimes only certain pods (especially kube-apiserver) show stale “Running” status, and sometimes all pods show stale status. This inconsistency is expected and depends on shutdown timing, network conditions, and system load.
Example
kubectl get pods -n kube-system | grep 172.10.5.16
# Output shows:
etcd-172.10.5.16                         1/1     Running   3      4h27m
kube-apiserver-172.10.5.16               1/1     Running   3      4h27m
kube-controller-manager-172.10.5.16      1/1     Running   3      4h26m
kube-scheduler-172.10.5.16               1/1     Running   3      4h27m

kubectl get node 172.10.5.16
# Output shows:
NAME          STATUS     ROLES           AGE     VERSION
172.10.5.16   NotReady   control-plane   4h27m   v1.35.1
Causes
This is a known Kubernetes limitation with graceful node shutdown. During shutdown:
All critical pods receive SIGTERM simultaneously
Kubelet attempts to update pod status to the API server
Race condition occurs:
Fast-exiting pods (
kube-controller-manager,kube-scheduler) terminate quickly and status is updated successfullykube-apiservertakes longer to shutdown (handling final requests)kube-vipreleases the VIP beforekube-apiserverfully terminatesWhen kubelet tries to update
kube-apiservercontainer status, the API server is unreachable (VIP down or network unavailable)Container state remains stale as “running”
Root Cause: Circular dependency - kubelet needs the API server to update the API server’s own status.
Impact
No functional impact on cluster operations
Pod-level status may show correct Phase (
Failed) and Ready (False)Only container-level state remains stale
Cluster continues to operate normally with remaining control planes
Pods are properly garbage collected based on
--terminated-pod-gc-thresholdsetting
Resolution
This behavior is expected and does not require action. The cluster continues to operate normally with the remaining control planes. When the node powers back on, pods restart automatically with incremented restart count.
Related Kubernetes Issues
This is a known Kubernetes issue tracked upstream:
Issue #110755: Kubelet doesn’t finish killing pods before shutdown
Issue #124448: GracefulNodeShutdown fails to update Pod status for system critical pods
Issue #109531: Pods in Running/Terminating state after shutdownGracePeriod expiry
Official Kubernetes Documentation
5. Storage & NFS Issues
5.1 NFS-Client Provisioner CrashLoopBackOff
Symptom
NFS-Client provisioner pod enters CrashLoopBackOff state.
Cause
NFS server not active at server_share_path.
Resolution
Ensure NFS server is active and reachable.
5.2 PowerScale CSI Controller Issues
Symptoms
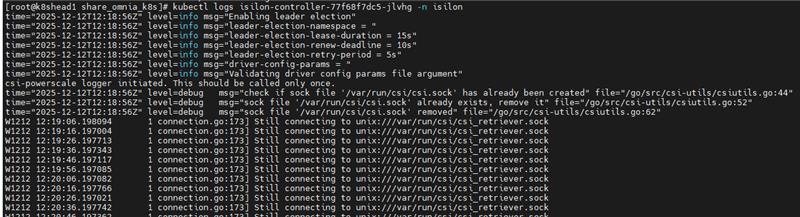
PowerScale (Isilon) CSI controller pod in CrashLoopBackOff after node reboot.

Cause
CSI controller fails to reconnect to PowerScale storage after node reboot
Storage connectivity issues or configuration problems
PowerScale (Isilon) service unavailability
Resolution
Inspect recent logs from the controller deployment:
kubectl logs deploy/isilon-controller -n isilon --all-containers=true | tail -n 60
Restart the Isilon controller deployment:
kubectl rollout restart deployment isilon-controller -n isilon
Restart the Isilon node daemonset:
kubectl rollout restart daemonset isilon-node -n isilon
5.3 Missing PowerScale CSI Driver
Symptom
PowerScale CSI driver is not deployed or available in the cluster.
Cause
Driver not listed in software_config.json.
Required Entry
{
  "name": "csi_driver_powerscale",
  "version": "v2.17.0",
  "arch": ["x86_64"]
}
For more information on deploying the Dell CSI-PowerScale driver, see Deploy CSI drivers for Dell PowerScale Storage Solutions
Resolution
Add the required entry to software_config.json and re-run the playbook.
For troubleshooting Kafka issues related to the missing CSI driver, see Section 7.1.
6. Slurm Issues
6.1 Nodes Entering DRAINED State
Symptom
scontrol show node <node> shows State=IDLE+DRAIN or State=DOWN+DRAIN.
Causes
To identify the root cause, first check the drain reason:
scontrol show node <node_name> | grep -i reason
Drain Reason |
Root Cause |
|---|---|
Kill task failed |
Epilog/prolog script error |
Not responding |
slurmd lost connection to slurmctld (network, firewall, or slurmd crash) |
Low RealMemory |
Node has less memory than configured in slurm.conf |
Node unexpectedly rebooted |
Hardware issue or kernel panic |
(blank/manual) |
Administrator manually drained the node |
Resolution
Resolution steps vary by root cause:
1. Epilog script error
chmod 0755 /etc/slurm/epilog.d/logout_user.sh
scontrol update nodename=<node> state=resume
scontrol reconfigure
2. Not responding
Check the slurmd service status on the compute node:
systemctl status slurmd      # On the compute node
systemctl restart slurmd      # If stopped
scontrol update nodename=<node> state=resume
3. Low RealMemory
Verify the actual memory available on the node:
free -m                        # Check actual memory on node
grep <node> /etc/slurm/slurm.conf  # Check configured RealMemory
Update the RealMemory value in slurm.conf to match the actual available memory, then run:
scontrol reconfigure
Warning
slurm.conf is managed by the slurm_config role. Manual edits will be overwritten on the next provision.yml run. Update the source configuration instead to make permanent changes.
4. Invalid State (Resource Mismatch)
Scenario
Nodes enter an invalid state when the hardware resources reported by Slurm do not match the actual node configuration. This typically occurs when incorrect iDRAC credentials cause the provisioning system to apply default resource values that do not reflect the actual hardware capabilities.
Resolution
Identify nodes in invalid state:
scontrol show node | grep -i invalid
SSH to the affected compute node:
ssh <node_name>
Retrieve actual hardware configuration:
slurmd -C

The ``slurmd -C`` command outputs comprehensive hardware information including CPU architecture, core count, threads per core, sockets, RealMemory, GPU presence and model, and other resource specifications.
Document the actual hardware values from the
slurmd -Coutput for comparison with the Slurm configuration.SSH to the Slurm control node:
ssh <slurm_controller_host>
Update slurm.conf to match actual hardware:
sudo nano /etc/slurm/slurm.conf

Locate the node configuration section and update the resource values (CPUs, RealMemory, GPUs, etc.) to match the actual hardware from step 3.
Apply the configuration changes:
sudo scontrol reconfigure
Resume the node:
sudo scontrol update nodename=<node_name> state=resume
Verify the node state:
sudo scontrol show node <node_name>

Confirm that the node no longer shows an invalid state and that the resource values are correct.
Note
When using the slurm_config role to manage slurm.conf, update the source configuration (inventory variables or configuration files) rather than manually editing /etc/slurm/slurm.conf. Manual edits are overwritten on the next provision.yml execution.
Prevention
To prevent resource mismatch issues: - Verify iDRAC credentials are correct before provisioning to ensure accurate hardware discovery
6.2 NVIDIA GPU, CUDA, and DCGM Issues
6.2.1 nvidia-smi Not Found or Driver Not Communicating
Symptom
nvidia-smi: command not found or nvidia-smi exits with a non-zero return code
Cause
NVIDIA driver installation failed during provisioning, or GPU hardware is absent on this node
Resolution
Verify GPU hardware is present on the node. If confirmed present, re-install the driver:
dnf install -y cuda-drivers
Review /var/log/nvidia_install.log for error details.
6.2.2 CUDA Toolkit Not Available on Node (nvcc Not Found)
Symptom
nvcc: command not found or /usr/local/cuda is empty
Cause
Toolkit installation did not complete on the designated installer node due to a repository or NFS error
NFS mount for the CUDA toolkit was not established at provisioning time
Resolution
Verify the NFS mount at /usr/local/cuda is present:
mount | grep cuda
If absent, re-mount manually. If the toolkit is not installed on the NFS share, review /var/log/cuda_toolkit_install.log on the installer node.
6.2.3 CUDA Toolkit NFS Mount Failed
Symptom
/usr/local/cuda is empty or not mounted after provisioning
Cause
NFS server was unreachable at provisioning time, or the NFS export is not configured with no_root_squash
Resolution
Verify NFS server reachability from the node. Verify the NFS export includes no_root_squash. Re-mount manually:
mount -t nfs <NFS_SERVER>:<path>/hpc_tools/cuda /usr/local/cuda
Verify the fstab entry is present for persistence.
6.2.4 nvidia-dcgm Service Inactive or Failed
Symptom
systemctl status nvidia-dcgm shows inactive or failed state
Cause
DCGM package installation failed due to an unavailable repository or a CUDA version mismatch
The NVIDIA driver was not functional at the time DCGM attempted to start
Resolution
Verify driver is functional: nvidia-smi. Identify the installed CUDA version: nvidia-smi | grep "CUDA Version". Re-install the matching DCGM package and restart the service. Review /var/log/dcgm_setup.log for errors.
6.2.5 DCGM Not Installed (dcgm.metrics_enabled Disabled)
Symptom
nvidia-dcgm service is not present on Slurm node, and /var/log/dcgm_setup.log is missing
Cause
dcgm.metrics_enabled is set to false under telemetry_sources in telemetry_config.yml, so Omnia intentionally skips DCGM installation during Slurm node cloud-init
Resolution
Set dcgm.metrics_enabled: true under telemetry_sources in input/telemetry_config.yml, re-run provisioning for affected Slurm nodes, then validate with systemctl status nvidia-dcgm and dcgmi discovery -l
6.2.6 DCGM Package Version Mismatch
Symptom
DCGM package installation fails with No match for argument or No packages found
Cause
The CUDA major version on the node does not have a matching datacenter-gpu-manager-4-cuda<N> package available in the configured local repository
Resolution
Verify the CUDA version: nvidia-smi | grep "CUDA Version". Confirm the corresponding DCGM package is present in the local Pulp repository. Update local_repo_config.yml to include the correct DCGM package version and re-run local_repo.yml.
6.2.7 nvidia-peermem Not Loading
Symptom
lsmod does not show nvidia_peermem; workloads requiring GPUDirect RDMA fail to initialize
Cause
Kernel headers were not available at provisioning time, causing the DKMS build to fail
Base NVIDIA kernel modules were not loaded prior to
nvidia-peermemload attempt
Resolution
Verify kernel headers:
ls /lib/modules/$(uname -r)/build
Install if missing:
dnf install -y kernel-devel-$(uname -r)
Load the module:
modprobe nvidia-peermem
Review /var/log/nvidia_peermem_install.log for details.
Note
If RDMA is not required for any workload on this node, this warning is non-blocking.
6.3 CUDA Toolkit and DCGM Setup Failure: Manual Recovery
Symptom
Automated GPU setup fails during provisioning.
Cause
Repository unavailability, NFS connectivity issues, or node initialization errors.
Resolution
Perform all recovery steps as root on the affected node. Verify that the shared NFS path is reachable and repositories are accessible before proceeding.
Step 1: Verify Prerequisites
Before attempting any recovery, confirm the following:
# Verify NFS reachability
showmount -e <NFS_SERVER_IP>

# Verify GPU hardware presence
lspci | grep -i nvidia

# Verify repository access
dnf repolist | grep -i cuda

# Verify available disk space
df -h /usr/local
Step 2: Recover NVIDIA Driver
If nvidia-smi is missing or returning errors:
dnf install -y cuda-drivers
Validate:
nvidia-smi
Step 3: Recover CUDA Toolkit
The CUDA toolkit recovery procedure differs depending on both the node type and whether a login or compiler node is present in the cluster. Identify your scenario before proceeding.
Scenario A — Login or Compiler Node present in the cluster
In this topology, the login/compiler node is the designated installer. It installs the toolkit to the shared NFS location at /hpc_tools/cuda. Slurm compute nodes mount this path at /usr/local/cuda and do not perform any installation themselves.
On the login or compiler node:
Check whether the toolkit is installed:
ls /hpc_tools/cuda/bin/nvcc 2>/dev/null && echo "Toolkit present" || echo "Toolkit NOT present"
If not present, trigger the installation manually:
CUDA_INSTALL_MANUAL=true /usr/local/bin/install_cuda_toolkit.sh
Note
Run this only after confirming no active toolkit installation is already in progress. Review /var/log/cuda_toolkit_install.log to check current installation status.
Validate on the login/compiler node:
ls /hpc_tools/cuda/bin/nvcc
nvcc --version
On a Slurm compute node (after toolkit is confirmed installed on NFS):
The compute node accesses the toolkit via an NFS mount at /usr/local/cuda. Verify the mount:
mount | grep cuda
If the mount is absent, re-mount manually:
mount -t nfs <NFS_SERVER>:<hpc_tools_path>/hpc_tools/cuda /usr/local/cuda
Validate on the compute node:
ls /usr/local/cuda/bin/nvcc
nvcc --version
Scenario B — No Login or Compiler Node in the cluster
In this topology, Slurm compute nodes are responsible for installing the toolkit themselves. The NFS hpc_tools share is mounted at /hpc_tools on all compute nodes, and the toolkit is installed to /hpc_tools/cuda by whichever node acquires the installation role. CUDA_HOME is set to /hpc_tools/cuda on all nodes.
Check whether the toolkit is installed on the shared NFS location:
ls /hpc_tools/cuda/bin/nvcc 2>/dev/null && echo "Toolkit present" || echo "Toolkit NOT present"
If not present, trigger the installation manually on any compute node:
CUDA_INSTALL_MANUAL=true /usr/local/bin/install_cuda_toolkit.sh
Note
Run this only after confirming no active toolkit installation is already in progress. Review /var/log/cuda_toolkit_install.log to check current installation status.
Validate:
ls /hpc_tools/cuda/bin/nvcc
nvcc --version
Step 4: Recover DCGM
If the nvidia-dcgm service is inactive or failed:
# Verify CUDA version on node
nvidia-smi | grep "CUDA Version"

# Install the appropriate DCGM package
dnf install -y datacenter-gpu-manager-4-cuda<N>

# Enable and start the service
systemctl enable nvidia-dcgm
systemctl start nvidia-dcgm
Validate:
systemctl status nvidia-dcgm
dcgmi discovery -l
journalctl -u nvidia-dcgm -n 100 --no-pager
Step 5: Recover nvidia-peermem (RDMA environments only)
If the nvidia-peermem module is not loaded:
# Verify kernel headers are available
ls /lib/modules/$(uname -r)/build

# Install kernel headers if missing
dnf install -y kernel-devel-$(uname -r)

# Load the module
modprobe nvidia-peermem
Validate:
lsmod | grep -E 'nv_peer_mem|nvidia_peermem'
Log File Reference
/var/log/nvidia_install.log: NVIDIA driver installation output/var/log/cuda_toolkit_install.log: CUDA toolkit installation output and timing/var/log/dcgm_setup.log: DCGM package install, service startup, GPU discovery/var/log/nvidia_peermem_install.log:nvidia-peermemDKMS build and load output
6.4 Benchmark assets missing on Slurm nodes
Symptom
Benchmark tool directories are missing or incomplete under
/hpc_tools.Expected benchmark artifacts are not visible on login/compiler/compute nodes.
Cause
Shared NFS path (
/hpc_tools) is not mounted or not accessible.pull_benchmarks.shorbenchmark_tools.listis missing under/hpc_tools/scripts.Pulp mirror endpoint is unreachable from the node.
Required benchmark content is not available in local repository/Pulp.
Tool directory already exists and contains files (script skips re-download by design).
Architecture mismatch (for example,
msr-safeonaarch64, which is skipped by design).
Resolution
Verify NFS and scripts path:
ls -ld /hpc_tools
ls -l /hpc_tools/scripts
Expected files:
/hpc_tools/scripts/pull_benchmarks.sh/hpc_tools/scripts/benchmark_tools.list
Run runtime staging script and review output:
/hpc_tools/scripts/pull_benchmarks.sh
Review runtime log:
tail -n 200 /var/log/pull_benchmarks.log
Validate staged benchmark directories:
ls -l /hpc_tools
ls -l /hpc_tools/osu-micro-benchmarks /hpc_tools/imb /hpc_tools/likwid /hpc_tools/papi /hpc_tools/geopm /hpc_tools/sionlib
Note
msr-safe is expected only on x86_64.
If a tool was skipped as already present:
Remove that tool directory only if refresh is required.
Re-run
/hpc_tools/scripts/pull_benchmarks.sh.
6.5 sacct Erroring Out or Returning Empty Results
Symptom
The sacct command returns no output or empty results when querying job accounting information.
Cause
slurmdbd service is not running
MariaDB service is not running (slurmdbd depends on MariaDB)
slurmdbd cannot communicate with the database
Port 6819 (slurmdbd port) is not listening
Resolution
Address the issue based on the specific root cause:
1. slurmdbd not running:
Restart the slurmdbd service and verify its operational status:
systemctl restart slurmdbd
systemctl status slurmdbd
If the service fails to start, review the system logs for error details:
journalctl -u slurmdbd -n 50 --no-pager
2. MariaDB not running:
Restart MariaDB and allow it to fully initialize before restarting slurmdbd:
systemctl restart mariadb
systemctl restart slurmdbd
3. Database credential mismatch:
Verify that the StorageUser and StoragePass credentials in /etc/slurm/slurmdbd.conf match the actual MariaDB user credentials:
grep -E 'StorageUser|StoragePass|StorageLoc' /etc/slurm/slurmdbd.conf
If the credentials are incorrect, update slurmdbd.conf with the correct values and restart the service:
systemctl restart slurmdbd
4. ClusterName mismatch:
Compare the cluster name configured in slurm.conf with what slurmdbd recognizes:
grep ClusterName /etc/slurm/slurm.conf
sacctmgr show clusters
If the cluster names do not match, re-register the cluster with the correct name:
sacctmgr add cluster <correct_cluster_name>
5. Port 6819 blocked by firewall:
Verify that port 6819 (slurmdbd port) is open in the firewall:
firewall-cmd --list-ports | grep 6819
If the port is not listed, add it to the firewall and reload the configuration:
firewall-cmd --add-port=6819/tcp --permanent
firewall-cmd --reload
systemctl restart slurmdbd
Validation
After applying the appropriate fix, confirm that accounting is functioning correctly:
# Verify the cluster is registered with slurmdbd

sacctmgr show clusters

# Query recent job accounting data

sacct -S now-1hours

# Confirm accounting storage type configuration

scontrol show config | grep AccountingStorage
7. Telemetry Issues
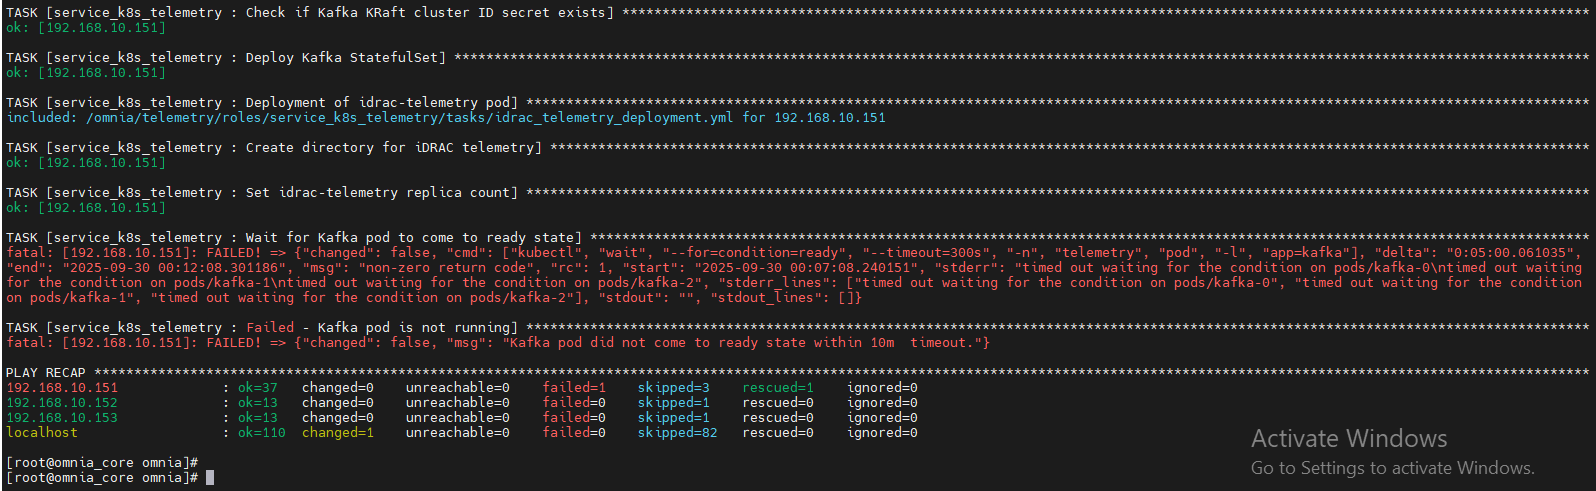
7.1 Kafka Pods CrashLoopBackOff
Symptom
Kafka pods enter CrashLoopBackOff state.
Cause
No service kube nodes
Missing CSI driver
PV full
Resolution
Ensure service kube nodes are booted
Add PowerScale CSI driver
Increase Kafka volume and configure log retention
For more information on adding the PowerScale CSI driver, see Section 5.3.
For more details on Kafka Pods CrashLoopBackOff issues, see Section 7.1.
7.2 Kafka “No space left on device”
Symptoms
New telemetry data is not being collected or forwarded to storage
Telemetry dashboards show data gaps or stale metrics
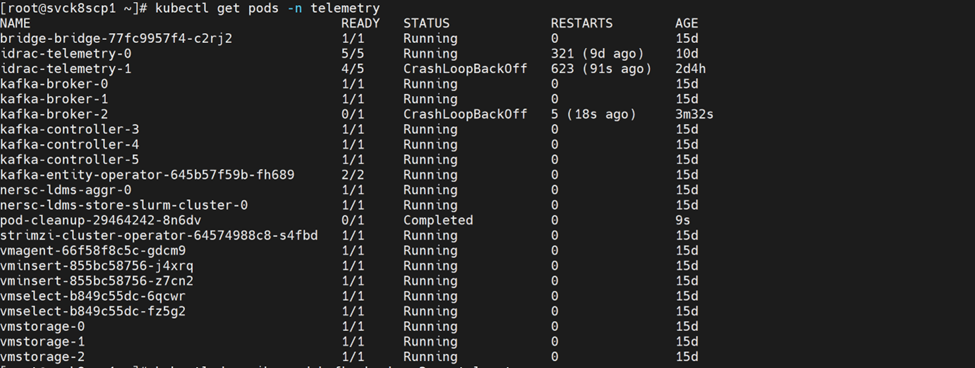
One or more kafka-broker pods are in CrashLoopBackOff state with repeated restarts
Dependent pods such as idrac-telemetry show high restart counts or are unable to reach a ready state
Services that produce or consume Kafka messages report connection or write failures
Running kubectl get pods -n telemetry shows the affected broker and telemetry pods:
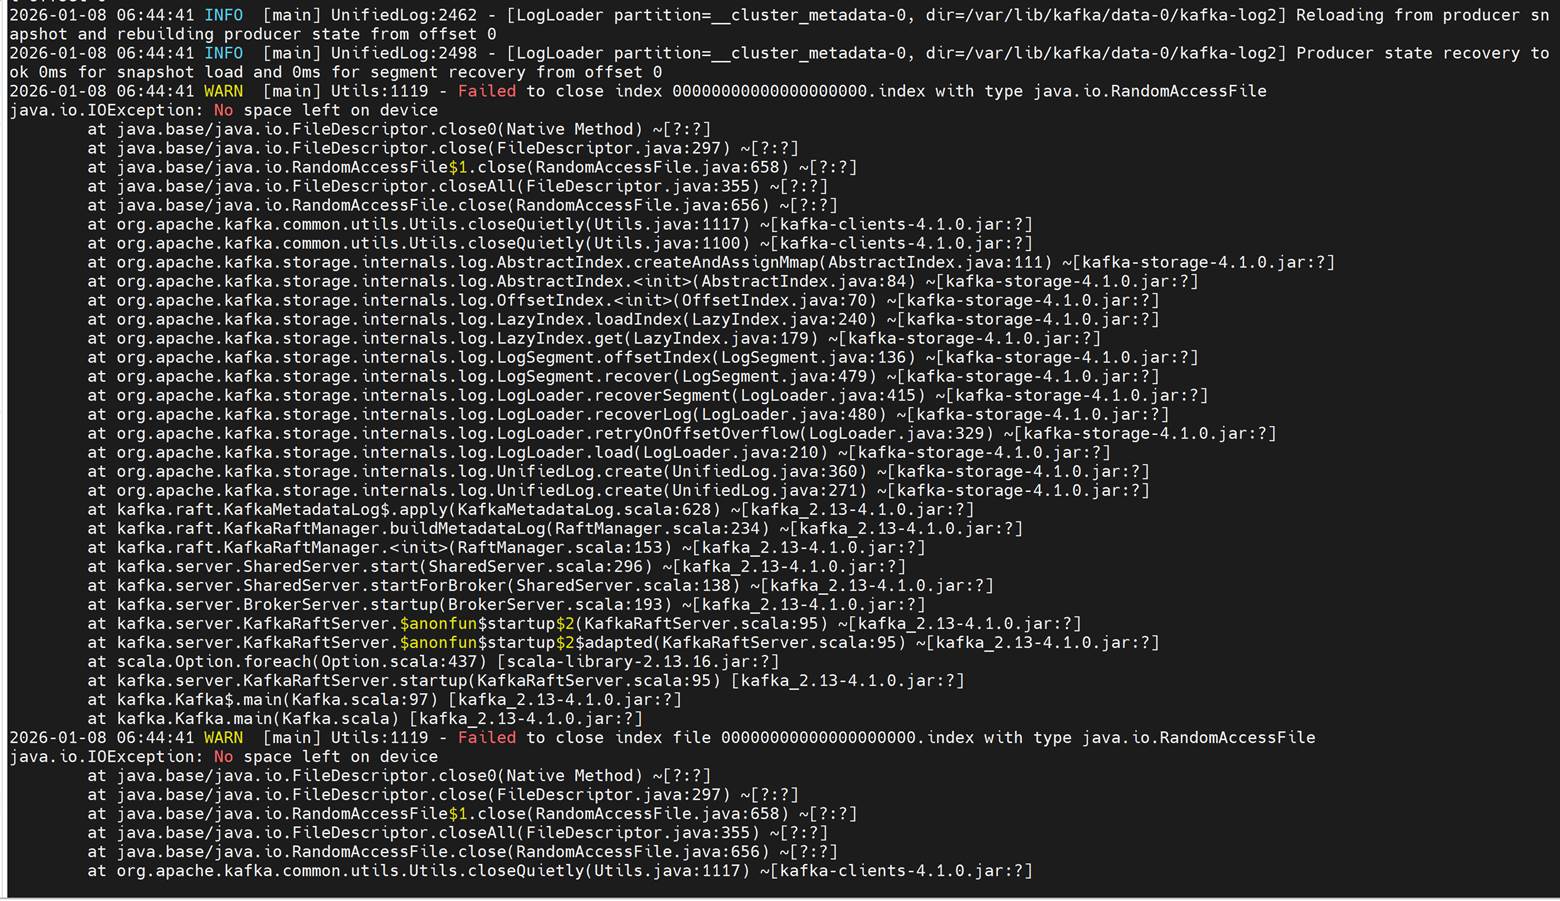
Inspecting the crashing Kafka broker logs reveals java.io.IOException: No space left on device errors:
Cause
Configured persistence_size for Kafka reaches capacity limit.
Resolution
The default 8Gi persistent volume size is suitable for small clusters (typically fewer than 5 nodes). For larger clusters, increase the persistence_size and configure Kafka retention settings log_retention_hours and log_retention_bytes so that old logs are deleted before the persistent volume reaches its limit.
Cleanup Script
If Kafka brokers are experiencing disk space issues and require immediate cleanup, use the following automated script to identify and remove old log segments:
#!/bin/bash
# ============================================================
# KAFKA PV FULL — AUTOMATED EMERGENCY CLEANUP (OMNIA)
# ============================================================
set -e
NAMESPACE="telemetry"
BROKER_COUNT=3
RETENTION_MS=3600000        # 1 hour temporary retention
SEGMENT_AGE_DAYS=3          # Delete segments older than 3 days

echo "============================================"
echo " KAFKA PV EMERGENCY CLEANUP - AUTOMATED"
echo "============================================"

# -------------------------------------------------------
# STEP 1: CHECK — Which brokers are full
# -------------------------------------------------------
echo ""
echo ">>> STEP 1: Checking broker disk usage..."
BROKERS_HEALTHY=true
RESPONSIVE_BROKER=""
for i in $(seq 0 $((BROKER_COUNT-1))); do
  echo "=== kafka-broker-$i ==="
  POD_STATUS=$(kubectl get pod -n $NAMESPACE kafka-broker$i -o jsonpath='{.status.phase}')
  READY=$(kubectl get pod -n $NAMESPACE kafka-broker$i -o jsonpath='{.status.conditions[?(@.type=="Ready")].status}')
  echo "  Pod Phase: $POD_STATUS"
  echo "  Ready: $READY"
  if kubectl exec -n $NAMESPACE kafka-broker$i -- echo "OK" 2>/dev/null; then
    echo "  Broker-$i: RESPONSIVE"
    [ -z "$RESPONSIVE_BROKER" ] && RESPONSIVE_BROKER=$i
  else
    echo "  Broker-$i: NOT RESPONSIVE (exec failed)"
    BROKERS_HEALTHY=false
  fi
done

# -------------------------------------------------------
# DECISION: Brokers responsive → Exit (no action needed)
#           Brokers crashing   → Path B (manual cleanup)
# -------------------------------------------------------
if [ "$BROKERS_HEALTHY" = true ]; then
  echo ""
  echo "All brokers are running and responsive."
  echo "This script is designed for emergency cleanup when brokers are crashlooping or PVs are full."
  echo "Since all brokers are healthy, no action is needed."
  echo "Exiting without making changes."
  exit 0
fi
  echo ""
  echo "============================================"
  echo " PATH B: BROKERS CRASHLOOPING — MANUAL FIX"
  echo "============================================"

  # ----------------------------------------------------
  # STEP 2: Get PVC names
  # ----------------------------------------------------
  echo ""
  echo ">>> STEP 2: Detecting PVC names..."
  echo "  Listing all PVCs in $NAMESPACE namespace..."
  kubectl get pvc -n $NAMESPACE

  # Try to detect PVC prefix
  FIRST_PVC=$(kubectl get pvc -n $NAMESPACE -o jsonpath='{.items[0].metadata.name}' 2>/dev/null)
  if [ -z "$FIRST_PVC" ]; then
    echo "ERROR: No PVCs found in $NAMESPACE namespace"
    exit 1
  fi
  echo "First PVC: $FIRST_PVC"

  # Extract PVC prefix by removing the broker number suffix
  # Pattern: data-0-kafka-broker-0 -> data-0-kafka-broker
  PVC_PREFIX=$(echo "$FIRST_PVC" | sed 's/-[0-9]$//')
  echo "PVC prefix detected: $PVC_PREFIX"

  # Verify PVC names match expected pattern
  echo "Verifying PVC names match expected pattern..."
  for i in $(seq 0 $((BROKER_COUNT-1))); do
    EXPECTED_PVC="${PVC_PREFIX}-${i}"
    if kubectl get pvc -n $NAMESPACE "$EXPECTED_PVC" >/dev/null 2>&1; then
      echo "  $EXPECTED_PVC: FOUND"
    else
      echo "  $EXPECTED_PVC: NOT FOUND (will cause cleanup pod to fail)"
      echo "  Listing all PVCs again for reference:"
      kubectl get pvc -n $NAMESPACE
      echo "ERROR: PVC naming pattern doesn't match. Please check PVC names and update script."
      exit 1
    fi
  done

  # ----------------------------------------------------
  # STEP 2.5: Stop broker pods to release PVCs
  # ----------------------------------------------------
  echo ""
  echo ">>> STEP 2.5: Stopping broker pods to release PVCs..."

  # Check if Kafka is managed by StatefulSet
  if kubectl get statefulset -n $NAMESPACE kafka-broker >/dev/null 2>&1; then
    echo "  Kafka brokers managed by StatefulSet: kafka-broker"
    echo "  Scaling down to 0 replicas..."
    kubectl scale statefulset -n $NAMESPACE kafka-broker --replicas=0
    echo "  Waiting for pods to terminate..."
    kubectl wait -n $NAMESPACE --for=delete pod/kafka-broker-0 --timeout=120s --ignore-not-found || true
    kubectl wait -n $NAMESPACE --for=delete pod/kafka-broker-1 --timeout=120s --ignore-not-found || true
    kubectl wait -n $NAMESPACE --for=delete pod/kafka-broker-2 --timeout=120s --ignore-not-found || true
  else
    echo "  Kafka brokers not managed by StatefulSet, deleting pods directly..."
    for i in $(seq 0 $((BROKER_COUNT-1))); do
      echo "  Deleting kafka-broker-$i..."
      kubectl delete pod -n $NAMESPACE kafka-broker$i --ignore-not-found --force --grace-period=0
    done
    echo "  Waiting for broker pods to terminate..."
    for i in $(seq 0 $((BROKER_COUNT-1))); do
      kubectl wait -n $NAMESPACE --for=delete pod/kafka-broker$i --timeout=60s || true
    done
  fi

  # ----------------------------------------------------
  # STEP 2.6: Cleanup any existing cleanup pods
  # ----------------------------------------------------
  echo ""
  echo ">>> STEP 2.6: Removing any existing cleanup pods..."
  for i in $(seq 0 $((BROKER_COUNT-1))); do
    kubectl delete pod -n $NAMESPACE kafka-cleanup$i --ignore-not-found
  done
  echo "  Waiting for cleanup pods to be removed..."
  sleep 5

  # ----------------------------------------------------
  # STEP 3: Deploy cleanup pods
  # ----------------------------------------------------
  echo ""
  echo ">>> STEP 3: Deploying cleanup pods..."
  for i in $(seq 0 $((BROKER_COUNT-1))); do
    PVC_NAME="${PVC_PREFIX}-${i}"
    echo "  Creating cleanup pod for PVC: $PVC_NAME"
    kubectl run kafka-cleanup-$i -n $NAMESPACE \
      --image=busybox \
      --restart=Never \
      --overrides='{
        "spec": {
          "containers": [{
            "name": "cleanup",
            "image": "busybox",
            "command": ["sh","-c","sleep 3600"],
            "volumeMounts": [{
              "name": "data",
              "mountPath": "/data"
            }]
          }],
          "volumes": [{
            "name": "data",
            "persistentVolumeClaim": {
              "claimName": "'$PVC_NAME'"
            }
          }]
        }
      }'
  done

  echo "  Waiting for cleanup pods..."
  for i in $(seq 0 $((BROKER_COUNT-1))); do
    echo "  Waiting for kafka-cleanup-$i..."
    if ! kubectl wait -n $NAMESPACE --for=condition=Ready pod/kafka-cleanup$i --timeout=120s; then
      echo "  ERROR: kafka-cleanup-$i failed to become Ready"
      echo "  Pod status:"
      kubectl get pod -n $NAMESPACE kafka-cleanup$i -o wide
      echo "  Pod events:"
      kubectl describe pod -n $NAMESPACE kafka-cleanup$i --tail=20
      exit 1
    fi
  done

  # ----------------------------------------------------
  # STEP 4: Show current usage + Clean old segments
  # ----------------------------------------------------
  echo ""
  echo ">>> STEP 4: Cleaning old segments (>${SEGMENT_AGE_DAYS} days)..."
  for i in $(seq 0 $((BROKER_COUNT-1))); do
    echo "=== kafka-broker-$i (BEFORE) ==="
    kubectl exec -n $NAMESPACE kafka-cleanup$i -- df -h /data

    # Detect actual data directory within PVC mount
    echo "  Detecting data directory within PVC..."
    PVC_DATA_DIR=$(kubectl exec -n $NAMESPACE kafka-cleanup$i -- \
      sh -c 'find /data -type d -name "*.log" 2>/dev/null | head -1 | xargs dirname 2>/dev/null || echo "/data"' 2>/dev/null)
    if [ "$PVC_DATA_DIR" = "/data" ]; then
      # Try common subdirectories
      for SUBDIR in "kafka-log0" "kraft-combined-logs" "data"; do
        if kubectl exec -n $NAMESPACE kafka-cleanup$i -- sh -c "test -d /data/$SUBDIR && echo /data/$SUBDIR" 2>/dev/null | grep -q .; then
          PVC_DATA_DIR="/data/$SUBDIR"
          break
        fi
      done
    fi
    echo "  Using data directory: $PVC_DATA_DIR"

    echo "  Cleaning..."
    DELETED=$(kubectl exec -n $NAMESPACE kafka-cleanup$i -- \
      sh -c 'count=0; find '"$PVC_DATA_DIR"' -name "*.log" -mtime +'"$SEGMENT_AGE_DAYS"' 2>/dev/null | while read f; do
        base=$(echo "$f" | sed "s/\.log$//")
        rm -f "${base}.log" "${base}.index" "${base}.timeindex" "${base}.snapshot"
        count=$((count+1))
        echo "$count"
      done | tail -1')
    echo "  Broker-$i: Deleted ${DELETED:-0} segments"
  done

  # ----------------------------------------------------
  # STEP 5: Verify space recovered
  # ----------------------------------------------------
  echo ""
  echo ">>> STEP 5: Verifying space recovered..."
  for i in $(seq 0 $((BROKER_COUNT-1))); do
    echo "=== kafka-broker-$i (AFTER) ==="
    kubectl exec -n $NAMESPACE kafka-cleanup$i -- df -h /data
  done

  # ----------------------------------------------------
  # STEP 6: Remove cleanup pods
  # ----------------------------------------------------
  echo ""
  echo ">>> STEP 6: Removing cleanup pods..."
  for i in $(seq 0 $((BROKER_COUNT-1))); do
    kubectl delete pod -n $NAMESPACE kafka-cleanup$i --ignore-not-found
  done

  # ----------------------------------------------------
  # STEP 7: Scale up StatefulSet to restore brokers
  # ----------------------------------------------------
  echo ""
  echo ">>> STEP 7: Scaling up StatefulSet to restore brokers..."
  if kubectl get statefulset -n $NAMESPACE kafka-broker >/dev/null 2>&1; then
    echo "  Scaling kafka-broker StatefulSet to $BROKER_COUNT replicas..."
    kubectl scale statefulset -n $NAMESPACE kafka-broker --replicas=$BROKER_COUNT
    echo "  Waiting for brokers to become ready..."
    for i in $(seq 0 $((BROKER_COUNT-1))); do
      kubectl wait -n $NAMESPACE --for=condition=Ready pod/kafka-broker$i --timeout=300s
      echo "  kafka-broker-$i is ready. Stabilizing..."
      sleep 60
    done
  else
    echo "  StatefulSet not found, brokers should auto-restart from Deployment"
    sleep 120
  fi

echo ""
echo "============================================"
echo " CLEANUP COMPLETE"
echo "============================================"
echo ""
echo ">>> Final disk usage:"
for i in $(seq 0 $((BROKER_COUNT-1))); do
  echo "=== kafka-broker-$i ==="
  kubectl exec -n $NAMESPACE kafka-broker$i -- df -h /var/lib/kafka/data-0 2>/dev/null || echo "  Still recovering..."
done
Script Usage
Save the script:
vi kafka-pv-cleanup.shMake the script executable:
chmod +x kafka-pv-cleanup.sh
Run the script:
./kafka-pv-cleanup.sh
Note
This script automatically detects whether brokers are responsive or crashlooping and applies the appropriate cleanup strategy. Modify the BROKER_COUNT, RETENTION_MS, and SEGMENT_AGE_DAYS variables at the top of the script to match your environment requirements.
7.3 LDMS Metrics Missing
Symptom
LDMS metrics do not appear in the telemetry dashboard or are missing expected data points.
Cause
LDMS aggregator pods are not running or experiencing errors
LDMS store daemon service is inactive
LDMS sampler service is not functioning correctly
Resolution
The LDMS data pipeline consists of three stages. Diagnose each stage in the following order:
Data Flow: Sampler (compute nodes, port 10001) → Aggregator pod (nersc-ldms-aggr-0) → Store pod (nersc-ldms-store-slurm-cluster-0) → Kafka ldms topic
Step 1: Verify LDMS sampler on compute nodes
On each Slurm/compute node, check the sampler service:
sudo systemctl status ldmsd.sampler.service
If the service is inactive or failed, restart and enable it:
sudo systemctl restart ldmsd.sampler.service
sudo systemctl enable ldmsd.sampler.service
Verify the sampler is producing metric sets locally:
/opt/ovis-ldms/sbin/ldms_ls -x sock -h localhost -p 10001 -a ovis
Expected output: a list of metric sets such as <hostname>/meminfo, <hostname>/vmstat, <hostname>/loadavg, <hostname>/procstat2, <hostname>/procnetdev2.
To view detailed metric values:
/opt/ovis-ldms/sbin/ldms_ls -x sock -h localhost -p 10001 -a ovis -l
If no metric sets are listed, check the sampler configuration and service logs:
cat /opt/ovis-ldms/etc/ldms/sampler.conf
journalctl -u ldmsd.sampler.service --no-pager -n 50
Step 2: Verify LDMS aggregator pod
Check the aggregator pod status:
kubectl get pods -n telemetry | grep ldms-aggr
If the pod is not in Running state, inspect pod events:
kubectl describe pod -n telemetry nersc-ldms-aggr-0
Check aggregator logs for connectivity errors:
kubectl logs -n telemetry nersc-ldms-aggr-0 --tail=50
Verify the aggregator is receiving metric sets from all producers:
kubectl exec -n telemetry nersc-ldms-aggr-0 -- bash -c 'source /ldms_conf/ldms-env.nersc-ldms-aggr.slurm-cluster-0.sh && /ldms_bin/ldms_ls.bash'
Expected output includes a JSON summary with TotalSets matching the number of metric schemas multiplied by the number of nodes (for example, 5 schemas × 2 nodes = 10 total sets).
Check producer connection status to verify all nodes show CONNECTED:
kubectl exec -n telemetry nersc-ldms-aggr-0 -- bash -c 'source /ldms_conf/ldms-env.nersc-ldms-aggr.slurm-cluster-0.sh && /opt/ovis-ldms/bin/ldmsd_controller -a ${LDMSD_AUTH_PLUGIN} -A ${LDMSD_AUTH_OPTION} -x sock -h ${LDMSD_HOST} -p ${LDMSD_PORT} --cmd prdcr_status'
If a producer shows DISCONNECTED, verify the sampler service is running on that compute node (Step 1) and that port 10001 is reachable from the aggregator pod.
To restart the aggregator pod:
kubectl delete pod -n telemetry nersc-ldms-aggr-0
The StatefulSet controller will automatically recreate the pod.
Step 3: Verify LDMS store daemon pod
Check the store pod status:
kubectl get pods -n telemetry | grep ldms-store
Check store logs for Kafka connectivity or storage errors:
kubectl logs -n telemetry nersc-ldms-store-slurm-cluster-0 --tail=50
Verify store daemon health and Kafka storage policy status:
kubectl exec -n telemetry nersc-ldms-store-slurm-cluster-0 -- bash -c 'source /ldms_conf/ldms-env.nersc-ldms-store-slurm-cluster-0.sh && /ldms_bin/ldms_stats.bash'
In the output, confirm:
Daemon State: readystrgp_statusshows the kafka storage policy inRUNNINGstateprdcr_statsshowsconnected_countequal to 1 (connected to aggregator)
If the store pod is failing to write to Kafka, verify the Kafka mTLS certificates are mounted:
kubectl exec -n telemetry nersc-ldms-store-slurm-cluster-0 -- ls -la /ldms_certs/
Expected files: ca.crt, user.crt, user.key.
To restart the store pod:
kubectl delete pod -n telemetry nersc-ldms-store-slurm-cluster-0
Step 4: Verify Kafka topic is receiving LDMS messages
Confirm the ldms Kafka topic exists:
kubectl exec -n telemetry kafka-broker-0 -- /opt/kafka/bin/kafka-topics.sh --describe --topic ldms --bootstrap-server kafka-kafka-bootstrap.telemetry.svc.cluster.local:9092
If the ldms topic does not exist, the store daemon has not connected successfully — review Step 3.
Note
After fixing any component, allow 1–2 minutes for the pipeline to stabilize before checking the telemetry dashboard for new metrics.
7.4 iDRAC Telemetry — No Metrics Reaching VictoriaMetrics / Kafka
Symptom
iDRAC metrics (power, thermal, fan, CPU) do not appear in VictoriaMetrics, or data is stale. The iDRAC telemetry receiver pods restart repeatedly or remain in 0/1 Ready state. New nodes do not appear as telemetry sources after provisioning.
Example errors
In the victoria-pump / kafka-pump container logs:
ERROR failed to subscribe to Redfish event service: 401 UnauthorizedERROR redfish: event subscription rejected (SubscriptionLimitExceeded)WARN activemq: connection refused tcp 127.0.0.1:61616ERROR victoria-pump: post to vmagent failed: dial tcp <vmagent-svc>:8429: connect: connection refused
Note
The 401 Unauthorized error specifically may occur due to credential drift — when iDRAC credentials are changed on the iDRAC side after a successful deployment. Omnia stores credentials in mysqldb at insert-time and does not continuously re-validate them against the iDRAC appliance.
Cause
Incorrect or expired iDRAC credentials in the vault (
idrac_username/idrac_password), resulting in 401 Unauthorized errorsRedfish subscription limit reached on iDRAC (stale subscriptions from prior runs block new ones)
iDRAC firmware does not support Redfish Telemetry/EventService (older iDRAC9 firmware)
Pipeline component failure (activemq, kafka-pump, or victoria-pump in the receiver pod is not ready)
Collection type misconfiguration (
telemetry_sources.idrac.collection_targetsdoes not include the expected sink)Network or firewall blocking OIM from reaching iDRAC on port 443, or receiver from reaching vmagent for scraping victoria-pump:2112/metrics or Kafka on port 9093 (TLS)
Diagnostics
Identify telemetry pods:
kubectl get pods -A | grep -Ei 'telemetry|idrac|victoria|kafka'
Inspect iDRAC telemetry receiver pod (contains mysqldb, activemq, idrac-telemetry-receiver, kafka-pump conditional, victoria-pump conditional, plus initContainer cleanup-mysql-locks):
kubectl -n telemetry describe pod <idrac-telemetry-pod>
kubectl -n telemetry logs <idrac-telemetry-pod> -c victoria-pump --tail=100
kubectl -n telemetry logs <idrac-telemetry-pod> -c kafka-pump --tail=100
Verify Redfish reachability and credentials from the OIM:
curl -sk -u "$IDRAC_USER:$IDRAC_PASS" https://<idrac-ip>/redfish/v1/EventService | head
List existing Redfish subscriptions (delete stale ones if at the limit):
curl -sk -u "$IDRAC_USER:$IDRAC_PASS" \
  https://<idrac-ip>/redfish/v1/EventService/Subscriptions
Confirm metrics landed in VictoriaMetrics:
curl -s 'https://<vmselect-svc>:8481/select/0/prometheus/api/v1/query?query=up' | head
Resolution
Correct
idrac_username/idrac_passwordinomnia_config_credentials.yml, then runansible-playbook provision/provision.yml, SSH to kube_vip and manually re-runbash <k8s_client_mount_path>/telemetry/telemetry.sh, then runtelemetry.yml. Verify with the curl command above (expect 200).Delete orphaned Redfish subscriptions using
curl -X DELETE ..., then allow the receiver to re-subscribe.Update iDRAC firmware to a version that supports Redfish EventService/Telemetry, then re-run telemetry.
If activemq/kafka-pump/victoria-pump is unhealthy, check container logs and restart the receiver pod (
kubectl delete pod <pod>) after confirming the root cause.Set
telemetry_sources.idrac.collection_targetsto [“victoria_metrics”], [“kafka”], or [“victoria_metrics”, “kafka”] to match where you expect data, then runansible-playbook provision/provision.yml, SSH to kube_vip and manually re-runbash <k8s_client_mount_path>/telemetry/telemetry.sh, then runtelemetry.yml.Ensure OIM can reach iDRAC on port 443 and the receiver can reach vmagent for scraping victoria-pump:2112/metrics and Kafka on port 9093 (TLS).
Note
iDRAC telemetry is enabled by telemetry_sources.idrac.metrics_enabled: true and routed per telemetry_sources.idrac.collection_targets in input/telemetry_config.yml. The receiver (mysqldb + activemq + idrac-telemetry-receiver + kafka-pump conditional + victoria-pump conditional, plus initContainer cleanup-mysql-locks) is a generated StatefulSet — modify inputs and re-run rather than editing the pod. Manifests (VMCluster, VLCluster, Kafka, iDRAC StatefulSet) are generated by provision.yml into telemetry/deployments/ on the NFS share, then applied by telemetry.sh, which cloud-init runs automatically only when a new control-plane node is provisioned. For an already-running cluster, after editing telemetry_config.yml, run ansible-playbook provision/provision.yml, SSH to kube_vip and manually re-run bash <k8s_client_mount_path>/telemetry/telemetry.sh, then run telemetry.yml only if the change involves iDRAC (credentials, collection_targets, BMC list).
7.5 VictoriaMetrics (Cluster Mode) — Pods Down, PVC Full, or Queries Failing
Symptom
One or more vmstorage, vminsert, or vmselect pods are in CrashLoopBackOff, Pending, or Evicted state. Recent samples are missing while older data is present (ingestion lag).
Omnia deploys VictoriaMetrics in cluster mode with TLS: vmstorage (3 replicas), vminsert (2), vmselect (2), and vmagent (2), with replication factor 2.
Example errors
vmstorage:
panic: cannot open storage at "/storage": no space left on device
vminsert:
cannot send data to vmstorage node "vmstorage-1:8400": connection timed out
vmselect:
error during search: cannot fetch data from vmstorage nodes: not enough healthy storage nodes (got 1, need 2)
Pod events:
0/3 nodes are available: 3 Insufficient memory.Pod ephemeral local storage usage exceeds the total limit of containers
Cause
vmstorage PVC is full (retention or ingest volume exceeded the provisioned storage)
Insufficient healthy replicas (with replication factor 2, losing 2+ vmstorage pods prevents vmselect from satisfying reads)
Resource pressure (pods Pending or Evicted due to insufficient memory or node disk pressure)
TLS or certificate mismatch (expired or mismatched certificates between vminsert/vmselect and vmstorage break inter-component communication)
vmagent backlog (vmagent cannot reach vminsert, queues fill, and remote_write stalls)
Diagnostics
Check pod and PVC status:
kubectl -n telemetry get pods -l 'app.kubernetes.io/name in (vmstorage,vminsert,vmselect,vmagent)' -o wide
kubectl -n telemetry get pvc | grep -i vmstorage
kubectl -n telemetry describe pod <vmstorage-pod> | sed -n '/Events/,$p'
Check disk usage inside a vmstorage pod:
kubectl -n telemetry exec <vmstorage-pod> -- df -h /storage
Check cluster health logs:
kubectl -n telemetry logs <vminsert-pod> --tail=100
kubectl -n telemetry logs <vmselect-pod> --tail=100
Check vmagent remote_write health (look for failed batches or queue size):
kubectl -n telemetry logs <vmagent-pod> --tail=100 | grep -Ei 'remote_write|error|drop'
Resolution
Expand the vmstorage PVC (if the StorageClass allows allowVolumeExpansion) or reduce retention. In Omnia, set retention and sizing through the telemetry input config, then run
ansible-playbook provision/provision.yml, SSH to kube_vip and manually re-runbash <k8s_client_mount_path>/telemetry/telemetry.sh; do not manually edit the StatefulSet.Restore quorum by bringing failed vmstorage pods back (resolve node disk pressure or memory issues), confirming vmselect reports enough healthy nodes.
Free node resources or adjust requests/limits via the input config; reschedule Evicted pods.
Regenerate or rotate the telemetry certificates via the playbook so vminsert/vmselect ↔ vmstorage mTLS matches.
Once vminsert is reachable, vmagent flushes its queue; verify lag closes via a recent-range query.
Sizing guidance: provision vmstorage capacity from sources × active series/node × samples/series × retention. Under-provisioning the PVC is the most common cause of this issue — size for peak source count (iDRAC + LDMS + DCGM + PowerScale + UFM + VAST + OME), not initial node count.
Note
cluster mode, replica counts, replication factor, TLS, and retention are rendered from input/telemetry_config.yml and input/service_k8s.json. Modify inputs and re-run; pod edits are transient.
7.6 VictoriaLogs (Cluster Mode) — Logs Missing or Unsearchable
Symptom
Log queries return nothing or only old data; new node or syslog events never appear. vlstorage, vlinsert, or vlselect pods restart repeatedly or remain unready. There is ingestion lag between event time and searchability.
Omnia (Q2) deploys VictoriaLogs in cluster mode: vlinsert, vlstorage, vlselect.
Example errors
vlstorage:
cannot create new part: no space left on device
vlinsert:
cannot proxy request to vlstorage: dial tcp <vlstorage-svc>:9491: i/o timeout
vlselect:
cannot perform query: some vlstorage nodes are unavailable
VLAgent:
syslog: failed to forward to vlinsert: connection refused
Cause
vlstorage PVC is full (log volume exceeded provisioned storage)
vlstorage nodes are unavailable (vlselect cannot complete queries)
VLAgent to vlinsert path is broken (syslog receiver cannot forward due to firewall, wrong service endpoint, or TLS mismatch)
No source configured (a device or service is not shipping syslog to VLAgent)
Diagnostics
Check pod and PVC status:
kubectl -n telemetry get pods -l 'app in (vlinsert,vlstorage,vlselect)' -o wide
kubectl -n telemetry get pvc | grep -i vlstorage
kubectl -n telemetry exec <vlstorage-pod> -- df -h /vlstorage
kubectl -n telemetry logs <vlinsert-pod> --tail=100
kubectl -n telemetry logs <vlselect-pod> --tail=100
Confirm logs are ingesting (LogsQL count over the last 5 minutes):
curl -s 'http://<vlselect-svc>:9471/select/logsql/query' \
  --data-urlencode 'query=*' --data-urlencode 'limit=1'
Resolution
Expand the vlstorage PVC or reduce log retention via the telemetry input config, then run
ansible-playbook provision/provision.yml, SSH to kube_vip and manually re-runbash <k8s_client_mount_path>/telemetry/telemetry.sh.Recover unavailable vlstorage pods so vlselect can query them.
Verify the syslog source points at the VLAgent service, the firewall permits the syslog port, and TLS matches; confirm forwarding in VLAgent logs.
Ensure the device or service (PowerScale, UFM, VAST, OS syslog) is configured to emit syslog to VLAgent.
Note
VictoriaLogs is enabled and sized through the telemetry input config; component layout and TLS are generated. Modify inputs and re-run.
8. Authentication Issues
8.1 LDAP Login Fails: Whitespace in LDIF
Symptom
After creating a user via LDIF import or Omnia’s user management, SSH login fails:
ssh newuser@compute-01
# Output: Permission denied (publickey,gssapi-keyex,gssapi-with-mic)
# Or: su: user newuser does not exist
id newuser
# Output: id: 'newuser': no such user
Cause
LDAP login failures have multiple common causes:
Whitespace or encoding in LDIF: Invisible trailing spaces/tabs in LDIF file corrupt attribute values
Missing POSIX attributes: User entry lacks required uidNumber, gidNumber, homeDirectory, or loginShell
Wrong objectClass: User created with inetOrgPerson but missing posixAccount objectClass
SSSD cache stale: SSSD on compute nodes has cached the “user not found” response
Incorrect base DN: User created in wrong OU/tree — not under the search base configured in SSSD
Resolution
Diagnostic Steps
Step 1: Verify user exists in LDAP
ldapsearch -x -H ldap://localhost -b "dc=omnia,dc=local" "(uid=newuser)"
Step 2: Check for whitespace in LDIF
cat -vet /path/to/user.ldif | grep -E '\s$'
Step 3: Verify POSIX attributes
ldapsearch -x -H ldap://localhost -b "dc=omnia,dc=local" "(uid=newuser)" \
  objectClass uidNumber gidNumber homeDirectory loginShell
Step 4: Check SSSD cache on compute node
sssctl user-show newuser
Step 5: Verify base DN matches SSSD config
grep ldap_search_base /etc/sssd/sssd.conf
Fix by Cause
1. Whitespace in LDIF
sed -i 's/[[:space:]]*$//' /path/to/user.ldif
ldapmodify -x -H ldap://localhost -D "cn=admin,dc=omnia,dc=local" -W -f /path/to/user.ldif
2. Missing POSIX attributes
ldapmodify -x -H ldap://localhost -D "cn=admin,dc=omnia,dc=local" -W <<EOF
dn: uid=newuser,ou=People,dc=omnia,dc=local
changetype: modify
add: objectClass posixAccount
add: uidNumber 10001
add: gidNumber 10001
add: homeDirectory /home/newuser
add: loginShell /bin/bash
EOF
3. SSSD cache stale
sssctl cache-remove
systemctl restart sssd
4. Wrong objectClass or base DN: Re-create user with correct attributes in proper OU under the LDAP search base.
8.2 User Login Through OpenLDAP Fails
Symptom
User login through OpenLDAP fails on cluster nodes. Commands such as ssh ldapuser@node, su - ldapuser, or id ldapuser return no user or authentication errors.
Cause
Possible causes include:
OpenLDAP container is not running
SSSD is not running or is misconfigured
TLS/SSL certificate issue
Incorrect LDAP connection type configured
Network connectivity issue to LDAP server
Stale SSH host key when connecting to OIM or container
Resolution
Check if the OpenLDAP container is running:
podman ps -a | grep omnia_auth
If the container is not running, start it:
systemctl start omnia_auth.service
Alternatively, re-run prepare_oim.yml with OpenLDAP enabled in software_config.json.
Verify SSSD status and configuration on the login or compute node:
systemctl status sssd
If SSSD is not running or misconfigured, restart it:
systemctl restart sssd
Verify that /etc/sssd/sssd.conf has the correct settings for ldap_uri, ldap_search_base, ldap_default_bind_dn, and ldap_default_authtok.
Check for TLS/SSL certificate issues:
Verify that the certificate file exists:
ls -la /etc/openldap/certs/ldapserver.crt
Ensure the certificate matches the one used by the omnia_auth container. If there is a mismatch, re-copy certificates from the shared NFS path (/opt/omnia/omnia/openldap/certs or the configured nfs_server_share_path) and restart SSSD:
systemctl restart sssd
Verify LDAP connection type consistency:
The default connection type is TLS on port 389. If security_config.yml sets ldap_connection_type: SSL, SSSD expects ldaps://<ldap_server_ip>:636. Verify that security_config.yml and sssd.conf are consistent regarding the connection type and port.
Test network connectivity to the LDAP server:
ping <ldap_server_ip>
ldapsearch -x -H ldap://<ldap_server_ip> -b <ldap_search_base>
If connectivity fails, verify firewall rules and ensure the LDAP server IP is reachable from the affected node.
Check for stale SSH host keys:
If the actual failure is an SSH connection to the OIM or omnia_core container (not an OpenLDAP bind), the error may indicate a stale SSH host key:
WARNING: REMOTE HOST IDENTIFICATION HAS CHANGED!
This occurs when the OIM or container was reprovisioned, leaving a stale entry in ~/.ssh/known_hosts. Remove the stale key:
ssh-keygen -R <hostname>
Or for a specific port:
ssh-keygen -R "[localhost]:<port>"
Then re-scan the host key:
ssh-keyscan <hostname> >> ~/.ssh/known_hosts
9. OpenCHAMI Issues
9.1 OpenCHAMI Stack Health Check — Diagnostic Command Reference
Note
This section is a diagnostic command reference, not a troubleshooting entry. It does not describe a specific symptom, cause, or resolution. Use these commands to verify the overall health of the OpenCHAMI stack on the OIM before or after troubleshooting a specific issue, or as a routine operational check.
When to use this reference:
Before running
provision.ymlto confirm the OpenCHAMI stack is readyAfter an OIM reboot to verify all services recovered
When investigating any OpenCHAMI-related failure described in Sections 9.2–9.9
As a post-recovery validation after applying a fix from any section above
Service health check:
# Check openchami.target and all component services
systemctl status openchami.target --no-pager
systemctl list-dependencies openchami.target --plain

# Verify individual services
systemctl status smd --no-pager
systemctl status bss --no-pager
systemctl status cloud-init-server --no-pager
systemctl status hydra --no-pager
systemctl status acme-deploy --no-pager
API connectivity check:
# Verify API endpoints are responding
ochami smd service status
ochami bss service status
ochami cloud-init service status
Log inspection:
# View recent logs for any component
journalctl -u smd -n 50 --no-pager
journalctl -u bss -n 50 --no-pager
journalctl -u cloud-init-server -n 50 --no-pager
journalctl -u hydra -n 50 --no-pager
Certificate and token status:
# Check certificate expiry
openssl s_client -connect localhost:8443 -showcerts </dev/null 2>&1 | openssl x509 -noout -dates

# Check access token validity
echo $<OIM_HOSTNAME>_ACCESS_TOKEN | cut -d. -f2 | base64 -d 2>/dev/null | jq .exp
Recovery action (if any service is not active):
sudo systemctl restart openchami.target
sleep 15
systemctl status openchami.target --no-pager
If the restart does not resolve the issue, refer to the specific troubleshooting entry in Sections 9.1–9.6 that matches the failing service.
9.2 Certificate Expiration
Symptoms
provision.ymlorochamiCLI commands fail with TLS errorsBSS or cloud-init-server returns connection refused or certificate errors
Nodes fail to PXE boot or cloud-init cannot reach the OIM
Example errors
curl: (60) SSL certificate problem: certificate has expired
x509: certificate has expired or is not yet valid
ochami bss service status: certificate verify failed
Cause
OpenCHAMI certificates (managed by acme-deploy) have reached their expiration date. The openchami_auth.yml task automatically restarts acme-deploy when BSS status fails, but manual intervention is needed if the auto-recovery does not succeed.
Diagnostics
# Check certificate expiry dates
openssl s_client -connect localhost:8443 -showcerts </dev/null 2>&1 | openssl x509 -noout -dates

# Check acme-deploy service status
systemctl status acme-deploy
journalctl -u acme-deploy -n 50 --no-pager

# Check if openchami.target and its dependencies are active
systemctl list-dependencies openchami.target --plain
Resolution
sudo openchami-certificate-update update <OIM_hostname>.<domain>
sudo systemctl restart openchami.target
If the issue persists after certificate update, restart the acme-deploy service and wait for certificate regeneration:
sudo systemctl restart acme-deploy
sleep 10
sudo systemctl restart openchami.target
9.3 Token Expired
Symptoms
ochamiCLI commands return 401 Unauthorizedprovision.ymlfails during OpenCHAMI authentication phaseBSS or SMD API calls return authentication errors
Example errors
{"error":"token is expired","status":401}
ochami bss boot params get: 401 Unauthorized
Failed to generate access token after 5 retries
Cause
The OpenCHAMI access token (JWT issued via Hydra OIDC client_credentials grant) has reached its expiration time. Omnia’s openchami_auth.yml task retries token generation up to 5 times with 5-second delays. Manual regeneration is required if automatic retries fail.
Diagnostics
# Check if the token environment variable is set
echo $<OIM_HOSTNAME>_ACCESS_TOKEN

# Inspect the token expiry (if jq is available)
echo $<OIM_HOSTNAME>_ACCESS_TOKEN | cut -d. -f2 | base64 -d 2>/dev/null | jq .exp

# Test BSS connectivity with the current token
ochami bss service status
Resolution
export <OIM_HOSTNAME>_ACCESS_TOKEN=$(sudo bash -lc 'gen_access_token')
If gen_access_token fails, verify the Hydra OIDC service is running:
systemctl status hydra
journalctl -u hydra -n 50 --no-pager
9.4 provision.yml Fails — OpenCHAMI Services Not Running
Symptoms
provision.ymlfails during the “Provision nodes, configure bss and cloud-init” playPlaybook output contains one of the following error messages:
cloud-init-server is not running after 16 retriesopenchami.target is not up after 16 retriesFailed to discover ochami nodes after retriessmd service is not runningochami bss boot params get: 401 Unauthorized(token expired)
Example errors
cloud-init-server is not running after 16 retries.
Next steps:
1. Check service status: systemctl status cloud-init-server
2. Check if openchami.target dependencies are satisfied: systemctl list-dependencies openchami.target
...

openchami.target is not up after 16 retries.
Next steps:
1. Check target status: systemctl status openchami.target
2. View logs: journalctl -u openchami.target -n 50
...

Failed to discover ochami nodes after retries.
Next steps:
1. Verify nodes.yaml is valid
2. Check SMD connectivity
...
Cause
provision.yml requires the OpenCHAMI stack (openchami.target, which manages smd, bss, cloud-init-server, hydra, acme-deploy) to be running on the OIM. Common causes of failure:
prepare_oim.yml was not run or failed partway through, leaving OpenCHAMI services undeployed
OpenCHAMI service crashed after deployment (certificate expiry, database failure, port conflict)
OIM was rebooted and
openchami.targetdid not recover automatically (dependency ordering, NIC autoconnect disabled)Access token expired — the JWT token issued by Hydra OIDC has a limited lifetime;
provision.ymlcallsopenchami_auth.ymlto regenerate it, but if Hydra itself is down, token generation failsSELinux context on OpenCHAMI workdir is incorrect (
provision.ymlsetscontainer_file_tbut this can be reset after NFS remount)nodes.yaml generation failed — invalid
pxe_mapping_file.csvor missingfunctional_groups_config.ymlproduced malformed input forochami discover
Diagnostics
Run these on the OIM to identify the specific failure:
# 1. Check openchami.target and all its component services
systemctl status openchami.target --no-pager
systemctl list-dependencies openchami.target --plain
systemctl status smd bss cloud-init-server hydra acme-deploy --no-pager

# 2. Check for failed services
systemctl --failed --no-pager

# 3. View service logs for the first failure
journalctl -u openchami.target -b --no-pager | tail -30
journalctl -u smd -b --no-pager | tail -30
journalctl -u cloud-init-server -b --no-pager | tail -30

# 4. Verify API connectivity
/usr/bin/ochami smd service status
/usr/bin/ochami bss service status
/usr/bin/ochami cloud-init service status

# 5. Check certificate validity
openssl s_client -connect localhost:8443 -showcerts </dev/null 2>&1 | openssl x509 -noout -dates

# 6. Check access token
echo $<OIM_HOSTNAME>_ACCESS_TOKEN | cut -d. -f2 | base64 -d 2>/dev/null | jq .exp

# 7. Verify nodes.yaml was generated correctly
cat /opt/omnia/openchami/workdir/nodes/nodes.yaml

# 8. Verify Omnia containers are running
podman ps -a --format "{{.Names}} {{.Status}}"
Resolution
Follow the appropriate resolution based on the diagnostic findings:
If prepare_oim.yml was never run or failed: Run the cleanup and re-deploy:
ansible-playbook utils/oim_cleanup.yml
ansible-playbook prepare_oim/prepare_oim.yml
After prepare_oim.yml completes successfully, re-run provision.yml.
If openchami.target services are down but were previously deployed: Restart the target and wait for all services:
sudo systemctl restart openchami.target
sleep 15
systemctl status openchami.target --no-pager
/usr/bin/ochami smd service status
/usr/bin/ochami cloud-init service status
If certificates have expired: Renew and restart:
sudo openchami-certificate-update update <OIM_hostname>.<domain>
sudo systemctl restart acme-deploy
sleep 10
sudo systemctl restart openchami.target
If the access token is expired and Hydra is running: Regenerate the token:
export <OIM_HOSTNAME>_ACCESS_TOKEN=$(sudo bash -lc 'gen_access_token')
If nodes.yaml is malformed: Verify
pxe_mapping_file.csvhas valid entries (MAC addresses, xnames, functional groups), then re-runprovision.yml— it regeneratesnodes.yamlfrom the CSV on every run.If SELinux context is incorrect: Re-apply the context:
chcon -R system_u:object_r:container_file_t:s0 /opt/omnia/openchami
After resolving the issue, re-run provision.yml:
ansible-playbook provision/provision.yml
Note
provision.yml automatically retries cloud-init-server (16 retries × 15 seconds) and attempts an openchami.target restart if the initial check fails. If the playbook still fails after these retries, the underlying service has a persistent problem that requires manual diagnosis.
9.5 SMD Node Discovery Fails
Symptoms
provision.ymlfails at “Discover ochami nodes” taskochami smd component getreturns empty results or HTTP 404Nodes are not visible in SMD after running
provision.yml
Example errors
Failed to discover ochami nodes after retries.
smd service is not running
ochami smd component get: no components found
HTTP 404: node <xname> not found in SMD
Cause
SMD service is not running or failed to start
openchami.targetand its dependencies are not fully activeInvalid or malformed
nodes.yaml(generated frompxe_mapping_file.csv)Network connectivity issues between the OIM and SMD
Diagnostics
# Check SMD service status
systemctl status smd
journalctl -u smd -n 50 --no-pager

# Check openchami.target and all dependencies
systemctl status openchami.target
systemctl list-dependencies openchami.target --plain

# Verify SMD API is reachable
ochami smd service status

# List registered nodes
ochami smd component get | jq '.Components[] | select(.Type == "Node")'

# Verify nodes.yaml is valid
cat /opt/omnia/openchami/workdir/nodes/nodes.yaml
Resolution
Restart
openchami.targetand verify all services are active:
sudo systemctl restart openchami.target
sleep 15
ochami smd service status
Verify
pxe_mapping_file.csvcontains valid MAC addresses and xnames, then re-runprovision.yml.
9.6 BSS Boot Parameters Not Applied
Symptoms
Nodes boot with the default image instead of the expected functional group image
ochami bss boot params getreturns empty or incorrect kernel/initrd pathsNodes do not pick up updated boot parameters after re-running
provision.yml
Example errors
node boots default image, ignoring BSS boot parameters
ochami bss boot params get: no params found for MAC <mac>
Missing kernel or initrd in BSS boot parameters
Cause
BSS service is not running or has stale data
The kernel/initrd images were not built or uploaded to S3 (
build_image_x86_64.ymlnot run)MAC addresses in
pxe_mapping_file.csvdo not match the node hardware
Diagnostics
# Check BSS service status
ochami bss service status

# List all boot parameters
ochami bss boot params get -F yaml

# Verify kernel/initrd in S3
s3cmd ls -Hr s3://boot-images
Resolution
Ensure
build_image_x86_64.yml(orbuild_image_aarch64.yml) completed successfully and images exist in S3.Verify MAC addresses in
pxe_mapping_file.csvmatch node hardware.Re-run
provision.ymlto refresh BSS boot parameters.
9.7 cloud-init-server Not Reachable
Symptoms
provision.ymlfails at “Verify cloud-init-server is reachable” taskNodes complete PXE boot but cloud-init fails to fetch user-data from the OIM
Example errors
cloud-init-server is not running after 16 retries.
ochami cloud-init service status: connection refused
Cause
cloud-init-serversystemd service is not runningopenchami.targetdependencies are not satisfiedCertificate issues preventing the service from starting
Diagnostics
# Check cloud-init-server status
systemctl status cloud-init-server
journalctl -u cloud-init-server -n 50 --no-pager

# Check if openchami.target dependencies are satisfied
systemctl list-dependencies openchami.target --plain

# Test cloud-init endpoint from OIM
ochami cloud-init service status
Resolution
# If certificate issues, restart acme-deploy first
sudo systemctl restart acme-deploy
sleep 10

# Restart the cloud-init-server
sudo systemctl restart cloud-init-server

# If still failing, restart the full openchami stack
sudo systemctl restart openchami.target
Once the service is running, re-run provision.yml.
9.8 Cloud-init Execution Failures on Compute Nodes
Symptoms
Node completes PXE boot but cloud-init does not finish successfully
Services (Slurm, Kubernetes, LDMS) are not configured after provisioning
Node is reachable via SSH but cloud-init scripts did not execute
Upgrade playbook reports “Cloud-init did not complete within timeout”
Example errors
In /var/log/cloud-init-output.log or /var/log/cloud-init.log on the compute node:
cloud-init[ERROR]: Failed running module cc_scripts_user
cloud-init status: error
WARNING: could not determine cloud type
stage failed: 'init-network' (duration: 120.0s, error: timeout waiting for metadata)
Cause
Network not ready when cloud-init attempts to fetch metadata from the OIM (
http://<admin_nic_ip>:8081/cloud-init/)cloud-init user-data or vendor-data contains errors (invalid YAML, missing scripts)
NFS mount failures during
runcmdscripts (NFS server unreachable, incorrectfstabentries)Stale cloud-init state on re-provisioned nodes (cloud-init skips modules it has already run)
Pulp certificate trust not established (
pulp_webserver.crtcopy failed), causingdnfpackage installs to failTimeout on CUDA driver installation or DOCA setup during
runcmdphase
Diagnostics
Run these commands on the affected compute node:
# Overall cloud-init status
cloud-init status --long

# Execution log (shows runcmd script output)
tail -100 /var/log/cloud-init-output.log

# Detailed error log
grep -i error /var/log/cloud-init.log | tail -30

# What user-data was injected by the OIM
cloud-init query userdata

# Which cloud-init modules completed successfully
ls /var/lib/cloud/instance/sem/

# Check NFS mounts (many cloud-init scripts depend on NFS)
mount | grep nfs
cat /etc/fstab | grep nfs

# Check Pulp certificate trust
ls /etc/pki/ca-trust/source/anchors/pulp_webserver.crt
openssl s_client -connect <admin_nic_ip>:2225 -showcerts </dev/null 2>&1 | grep -i verify
Resolution
If cloud-init is still running, wait for it to complete (check with
cloud-init status --long).If cloud-init completed with errors, review the specific failure in
/var/log/cloud-init-output.log. Common sub-failures:NFS mount failure: Verify OIM NFS service is reachable from the node (
showmount -e <admin_nic_ip>)Pulp cert trust failure: Manually copy the certificate and update trust:
cp /cert/pulp_webserver.crt /etc/pki/ca-trust/source/anchors/ && update-ca-trust
CUDA/DOCA timeout or failure: These are non-critical — cloud-init scripts use
|| echo "failed (non-critical)"so the overall provisioning continues. However, GPU workloads will not function until these components are recovered. Verify the status and recover if needed:
Verify CUDA driver:
# Check if NVIDIA driver is functional
nvidia-smi
# Expected: GPU listing with driver version. If "command not found" or error, driver needs recovery.

# Review driver install log
tail -30 /var/log/nvidia_install.log
Verify CUDA toolkit:
# Check if toolkit is available
ls /usr/local/cuda/bin/nvcc 2>/dev/null && nvcc --version || echo "CUDA toolkit NOT available"

# Check NFS mount for shared toolkit
mount | grep cuda

# Check toolkit installation log
tail -30 /var/log/cuda_toolkit_install.log

# Check lock manager status (shared NFS install)
cat /hpc_tools/cuda/.cuda_install_status.log 2>/dev/null
Verify DCGM:
# Check DCGM service
systemctl status nvidia-dcgm --no-pager
dcgmi discovery -l

# Review DCGM setup log
tail -30 /var/log/dcgm_setup.log
Verify DOCA-OFED:
# Check if DOCA is installed
rpm -q doca-ofed && echo "DOCA-OFED installed" || echo "DOCA-OFED NOT installed"

# Check InfiniBand device status
ibstat 2>/dev/null || echo "ibstat not available"

# Check DOCA MPI environment
ls /opt/mellanox/doca/tools/ 2>/dev/null
Verify nvidia-peermem (RDMA environments only):
# Check if peermem module is loaded
lsmod | grep -E 'nv_peer_mem|nvidia_peermem'

# Review install log
tail -20 /var/log/nvidia_peermem_install.log
If any component failed, refer to Section 6.3 (CUDA Toolkit and DCGM Setup Failure: Manual Recovery) for step-by-step recovery procedures.
For stale cloud-init state on re-provisioned nodes, the node image should be rebuilt via
build_image_x86_64.ymlto ensure a clean/var/lib/cloudstate. Do not manually runcloud-init cleanon provisioned nodes as this may break existing configuration.If cloud-init timed out during upgrade, SSH to the node and wait for completion, then re-run the upgrade playbook (completed steps are skipped automatically).
Note
Omnia collects cloud-init logs from all node types during log collection (log_collector/collect.yml). The collected files include /var/log/cloud-init.log and /var/log/cloud-init-output.log.
10. General Issues
10.1 Playbook Fails Due to Hardware, Network, or Storage Issues
Symptoms
Any Omnia playbook (prepare_oim.yml, local_repo.yml, provision.yml, telemetry.yml, upgrade.yml) terminates with a fatal Ansible error before completing. Typical error patterns include:
SSH connectivity failures:
UNREACHABLE! => {"msg": "Failed to connect to the host via ssh"}NFS mount or access errors:
mount.nfs: access denied,Stale file handle,Input/output errorPackage installation failures:
Failed to download metadata for repo,Cannot prepare internal mirrorlistDisk space exhaustion:
No space left on device,OSError: [Errno 28]DNS resolution failures:
Could not resolve host,Name or service not knownPodman or container runtime failures:
Error: unable to start container,container storage is corruptedPermission or SELinux denials:
Permission denied,avc: deniedHardware or BMC unreachable:
ipmitool: Unable to establish session,Redfish connection refused
Cause
Omnia playbooks depend on a healthy OIM operating environment. Common root causes include:
Network: Management NIC is down or misconfigured, VLAN or routing changed, firewall blocking required ports (SSH 22, Pulp 2225, S3, OpenCHAMI 8443), DNS unavailable
Storage: NFS server unreachable, NFS export changed or deleted, local disk full (
/opt/omnia,/var/lib/containers,/var/lib/pulp), inode exhaustionHardware: Node powered off, BMC credentials changed, RAID degraded, NIC link down, GPU hardware failure
Certificates: TLS certificates expired (Pulp, OpenCHAMI, telemetry), system clock drift causing certificate validation failures
Container runtime: Podman storage corrupted after unclean shutdown, container images pruned or missing
Resolution
Run diagnostics on the OIM to isolate the failure domain:
# Check system health
systemctl is-system-running
systemctl --failed --no-pager

# Check disk space (OIM critical paths)
df -h /opt/omnia /var/lib/containers /var/lib/pulp /tmp

# Check NFS availability
findmnt -t nfs,nfs4
showmount -e <nfs_server_ip>

# Check network to compute nodes
ping -c 2 <compute_node_ip>
ip -brief address
nmcli device status

# Check DNS
getent hosts <compute_node_hostname>
getent hosts <oim_hostname>

# Check Omnia containers
podman ps -a --format "{{.Names}} {{.Status}}"

# Check Omnia services
systemctl status omnia.target --no-pager
systemctl status openchami.target --no-pager

# Check Pulp
curl -sk https://localhost:2225/pulp/api/v3/status/ | head

# Check clock (certificate-sensitive services fail with clock drift)
timedatectl status

# Check recent errors
journalctl -b -p err..alert --no-pager | tail -50
Resolve the identified failure domain:
Network issues: Restore connectivity, verify interface configuration, check firewall rules (firewall-cmd --list-all), verify DNS, and ensure management NIC is up with correct IP.
Storage issues: Free disk space (prune old container images with podman image prune -a, remove stale logs), restore NFS mounts (mount <mount_point>), verify NFS export permissions.
Hardware issues: Verify BMC reachability (ipmitool -I lanplus -H <bmc_ip> -U <user> -P <pass> chassis status), power-cycle affected node, replace failed hardware.
Certificate issues: Renew OpenCHAMI certificates (sudo openchami-certificate-update update <hostname>.<domain>), restart affected services, correct system clock.
Container runtime issues: If Podman storage is corrupted, reset with podman system reset (destructive — requires re-running prepare_oim.yml).
After resolving the root cause, re-run only the failed playbook. Do not re-run the entire stack if only one playbook failed.
Note
Increase Ansible verbosity (-vvv) when re-running to capture detailed error output for root-cause analysis.
10.2 Cluster Not Recovering After Power Cycle
Symptom
After the Omnia Infrastructure Manager (OIM) and cluster nodes are powered on, one or more of the following conditions may occur:
One or more compute nodes remain NotReady, Down, Unknown, or otherwise unavailable
Kubernetes nodes do not rejoin the cluster
Kubernetes pods remain in Pending, ContainerCreating, CrashLoopBackOff, or Unknown state
Slurm nodes remain DOWN, DRAIN, NOT_RESPONDING, or are missing from sinfo
Omnia services on the OIM are inactive or failed
OpenCHAMI, Pulp, authentication, provisioning, or related Podman containers are not running
Compute nodes cannot reach the OIM over the management network
NFS-backed directories are unavailable or commands accessing them hang
Cluster applications fail because shared storage, DNS, time synchronization, or control-plane services are unavailable
Note
Do not immediately reprovision an affected node. First determine whether the failure is caused by an unavailable OIM service, network connectivity, shared storage, or a node-local service.
Cause
The compute nodes were powered on before the OIM became fully operational
One or more services associated with omnia.target failed to start
An Omnia Podman container stopped or entered an unhealthy state
The management interface, routing, DNS, firewall, or VLAN configuration did not recover correctly
An NFS server or NFS mount is unavailable
Time synchronization has not recovered
Kubernetes or Slurm node services failed to start
A node retained stale network, mount, or runtime state after the power interruption
The node operating system or provisioning state was damaged by an ungraceful shutdown
Resolution
Perform the following checks in order. Resolve OIM-wide dependencies before troubleshooting individual compute nodes.
Verify that the OIM is fully operational
Log in to the OIM and verify that the operating system has completed startup:
uptime
systemctl is-system-running
systemctl --failed --no-pager
If systemctl is-system-running reports starting, wait for startup jobs to complete and run the command again. If it reports degraded, examine the failed units:
systemctl --failed --no-pager
Do not power-cycle the compute nodes again until the required OIM services are operational.
Verify Omnia services on the OIM
Check the Omnia core service and the services associated with omnia.target:
systemctl status omnia_core.service --no-pager
systemctl list-dependencies omnia.target
The Omnia deployment documentation identifies omnia_core.service, pulp.service, omnia_auth.service, and the OpenCHAMI services under openchami.target (smd, bss, cloud-init-server, hydra, acme-deploy) as dependencies that may be present under omnia.target. The exact set depends on the deployed configuration.
List failed Omnia and OpenCHAMI-related services:
systemctl --failed --no-pager
systemctl status omnia.target --no-pager
systemctl status openchami.target --no-pager
For each failed service, inspect its journal. For example:
journalctl -u omnia_core.service -b --no-pager
journalctl -u pulp.service -b --no-pager
journalctl -u openchami.target -b --no-pager
To display recent high-priority errors from the current boot:
journalctl -b -p err..alert --no-pager
If a service failed because one of its dependencies was unavailable, correct the dependency first. Then restart only the affected service:
systemctl restart <service_name>
systemctl status <service_name> --no-pager
Replace <service_name> with the failed unit displayed by systemctl --failed. Avoid repeatedly restarting omnia.target without first reviewing the failed service logs. Repeated restarts can obscure the original failure and unnecessarily interrupt healthy services.
Verify Omnia Podman containers
List all containers, including containers that exited during startup:
podman ps -a
Check a specific container:
podman ps -a --filter name=<container_name>
podman inspect <container_name> --format 'status={{.State.Status}} exit_code={{.State.ExitCode}} error={{.State.Error}}'
View its recent logs:
podman logs --tail 200 <container_name>
If the container is managed by a systemd unit, restart the corresponding systemd service rather than starting the container manually:
systemctl restart <service_name>
systemctl status <service_name> --no-pager
Use the container logs and the associated systemd journal to determine whether the failure is related to storage, port binding, certificates, database availability, or another service dependency.
Verify network recovery between the OIM and compute nodes
On the OIM, check the management interfaces, addresses, routes, and NetworkManager state:
ip -brief address
ip route
nmcli device status
nmcli connection show --active
Test connectivity to each affected compute node:
ping -c 4 <compute_node_ip>
ip neigh show <compute_node_ip>
If hostnames are used, verify name resolution separately:
getent hosts <compute_node_hostname>
ping -c 4 <compute_node_hostname>
On the affected compute node, test the return path to the OIM:
ip -brief address
ip route
ping -c 4 <oim_ip>
getent hosts <oim_hostname>
Interpret the results as follows:
No management IP address: Check the interface and NetworkManager connection
No route to the OIM: Correct the route, VLAN, or gateway configuration
IP address works but hostname fails: Investigate DNS or /etc/hosts
OIM can reach the node but the node cannot reach the OIM: Check asymmetric routing, firewall rules, bonding, or VLAN configuration
Duplicate or stale neighbor entry: Check for an IP address conflict before clearing the entry
To inspect recent network-service errors:
journalctl -u NetworkManager -b --no-pager
Verify time synchronization
Significant clock differences can prevent certificate-based services and distributed cluster components from operating correctly. Run the following command on the OIM and on an affected node:
timedatectl status
If Chrony is used:
systemctl status chronyd --no-pager
chronyc tracking
chronyc sources -v
Resolve DNS, routing, or NTP-source connectivity problems before continuing.
Verify NFS and shared-storage availability
On the OIM and affected nodes, list NFS filesystems:
findmnt -t nfs,nfs4
Check a specific expected mount point:
findmnt <mount_point>
mountpoint <mount_point>
timeout 10 ls -la <mount_point>
If the mount is absent, examine its configuration:
grep -E '^[^#].+[[:space:]]nfs4?[[:space:]]' /etc/fstab
Test whether the NFS server is reachable:
ping -c 4 <nfs_server>
Where supported, list exported filesystems:
showmount -e <nfs_server>
Review mount-related errors from the current boot:
journalctl -b --no-pager | grep -Ei 'nfs|mount|rpc|stale|timed out'
After confirming that the NFS server and network are available, mount only the affected filesystem:
mount <mount_point>
findmnt <mount_point>
Warning
Do not use mount -a as the first recovery action on a production cluster. It attempts every configured filesystem and can make diagnosis more difficult if multiple remote filesystems are unavailable. If a command against the mount point hangs, investigate the NFS server and network path before restarting workload services.
Check the cluster manager
Use the checks applicable to the cluster manager deployed in the environment.
Kubernetes-based cluster
From a host with the required Kubernetes configuration:
kubectl get nodes -o wide
kubectl get pods -A -o wide
kubectl get events -A --sort-by=.metadata.creationTimestamp
For an affected node:
kubectl describe node <node_name>
Look for conditions such as:
Ready=False or Ready=Unknown
NetworkUnavailable=True
DiskPressure=True
MemoryPressure=True
Expired certificates or authentication failures
Container runtime or CNI initialization failures
On the affected node, check the node agent and container runtime used by the deployment:
systemctl status kubelet --no-pager
journalctl -u kubelet -b --no-pager
systemctl status containerd --no-pager
journalctl -u containerd -b --no-pager
If the services are installed but inactive, and their network and storage dependencies are healthy, restart them:
systemctl restart containerd
systemctl restart kubelet
Recheck the node:
kubectl get node <node_name> -o wide
kubectl describe node <node_name>
Note
Do not delete or reprovision the node solely because it temporarily reports NotReady.
Slurm-based cluster
On the Slurm control node, check cluster and node state:
sinfo -R
sinfo -N -l
scontrol show nodes
On an affected compute node:
systemctl status slurmd --no-pager
journalctl -u slurmd -b --no-pager
On the Slurm control node:
systemctl status slurmctld --no-pager
journalctl -u slurmctld -b --no-pager
After correcting the underlying network, storage, time, or service problem, restart only the failed Slurm daemon:
systemctl restart slurmd
If the node is healthy but remains marked DOWN, return it to service from the control node:
scontrol update NodeName=<node_name> State=RESUME
Then verify:
sinfo -N -l
scontrol show node <node_name>
Note
Do not resume a node until slurmd, shared storage, networking, and required accelerators or devices are healthy.
Reboot only the affected node, if necessary
If the OIM, networking, time synchronization, shared storage, and cluster services are healthy but a node still does not recover, perform a controlled reboot of only that node:
systemctl reboot
After the node returns, verify:
systemctl --failed --no-pager
ip -brief address
findmnt -t nfs,nfs4
Then repeat the Kubernetes or Slurm checks.
Reprovision only after isolating the failure to the node
Reprovision the affected node only when all the following conditions are true:
OIM services and containers are healthy
The node has working management-network connectivity
DNS and time synchronization are operating correctly
Required NFS or shared-storage services are available
Other nodes with the same configuration have recovered successfully
Node-local services continue to fail after a controlled reboot
Logs indicate damaged system state, missing configuration, failed provisioning artifacts, or an unrecoverable operating-system problem
Before reprovisioning, collect diagnostic information:
journalctl -b --no-pager > /tmp/current-boot.log
journalctl -b -1 --no-pager > /tmp/previous-boot.log
systemctl --failed --no-pager > /tmp/failed-services.log
ip address show > /tmp/ip-address.log
ip route show > /tmp/ip-route.log
findmnt > /tmp/findmnt.log
Also save:
Output of
podman ps -aand relevant container logs from the OIMOutput of
kubectl describe node <node_name>for KubernetesOutput of
scontrol show node <node_name>for SlurmRelevant Omnia and provisioning logs
This information should be retained for root-cause analysis even if reprovisioning restores the node.
Validation
The recovery is complete only when all applicable checks succeed:
systemctl --failed --no-pager
podman ps -a
ochami smd service status
ochami bss service status
For Kubernetes:
kubectl get nodes
kubectl get pods -A
For Slurm:
sinfo -R
sinfo -N -l
Additionally, verify that:
No required OIM service is failed
Required Podman containers are running
All expected nodes are reachable
Shared filesystems are mounted and responsive
Cluster nodes have returned to their expected state
A representative workload can be submitted and completed successfully
Prevention
For subsequent planned startup operations:
Power on the OIM first
Wait until the operating system, omnia.target dependencies, required containers, networking, and shared storage are healthy
Power on the control or service nodes, if separate
Verify the cluster control plane
Power on compute nodes in manageable batches
Validate node registration and service health before starting production workloads
10.3 InfiniBand Issues
Symptoms
InfiniBand ports stuck in Initializing state after boot.
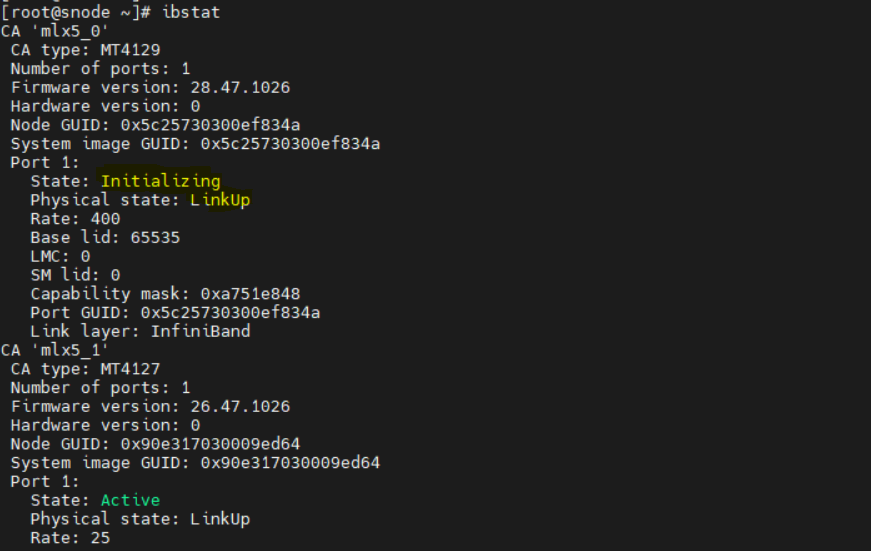
Cause
The Open Subnet Manager (OpenSM) service is not running on the InfiniBand (IB) switch.
Resolution
Ensure that the Open Subnet Manager service is enabled and running on the InfiniBand switch.
After enabling OpenSM on the IB switch, do the following: * PXE boot all the IB NIC based nodes. * Run the following command on the host:
ibstat* Verify that the InfiniBand ports state transition to:State: Active
10.4 System Recovery Issues
10.4.1 Omnia containers not coming up after OIM reboot
Symptom
Omnia containers fail to start after OIM reboot.
Cause
The Admin NIC on the OIM may have its autoconnect settings disabled (autoconnect=no), which stops it from reconnecting automatically after a reboot.
Resolution
Ensure that the Admin NIC on the OIM is configured with autoconnect=yes so it automatically reconnects after reboot. If you changed this configuration, reboot your OIM once to nullify any cache-related or stale configuration issues.
10.4.2 PostgreSQL container deployment fails after cleanup
Symptom
PostgreSQL container deployment fails after running oim_cleanup.yml.
Cause
Database initialization issues when existing data is present.
Resolution
To reuse the existing PostgreSQL database data available at
postgres_data_dir, re-runprepare_oim.ymlusing the same PostgreSQL database credentials that you used in the previous deployment.To delete the existing PostgreSQL database data and create a new one, run the following commands:
ansible-playbook utils/oim_cleanup.yml -e postgres_backup=false
The playbook deletes the PostgreSQL data at postgres_data_dir and the associated data and log files. After cleanup completes, re-run prepare_oim.yml to deploy a new postgres_container_name container.
11. Upgrade and Rollback Issues
11.1 Lock File Issues
11.1.1 Upgrade fails: “A rollback is currently in progress”
Symptoms
The upgrade playbook aborts with the message: A rollback is currently in progress. Cannot start an upgrade.
Causes
The file /opt/omnia/.data/rollback_in_progress.lock exists, indicating a rollback is either running or was previously interrupted without cleanup.
Resolution
Check if a rollback process is actually running:
ps aux | grep rollback
If no rollback process is active, the lock is stale. Remove it manually:
rm /opt/omnia/.data/rollback_in_progress.lock
Rerun the upgrade playbook.
11.1.2 Rollback fails: “An upgrade is currently in progress”
Symptoms
The rollback playbook aborts with the message: An upgrade is currently in progress. Cannot start a rollback.
Causes
The file /opt/omnia/.data/upgrade_in_progress.lock exists.
Resolution
Check if an upgrade process is actually running:
ps aux | grep upgrade
If no upgrade process is active, remove the stale lock:
rm /opt/omnia/.data/upgrade_in_progress.lock
Rerun the rollback playbook.
11.2 Manifest Issues
11.2.1 Manifest shows “partial” status after upgrade
Symptoms
The upgrade completes but upgrade_status is partial instead of completed.
Causes
One or more components did not reach completed or skipped status.
Resolution
Check which components are not completed:
cat /opt/omnia/.data/upgrade_manifest.yml
Review the component status to identify the failed component.
After fixing the issue, rerun the full upgrade. Already-completed components are skipped automatically:
cd /omnia/upgrade
ansible-playbook upgrade.yml
11.2.2 Manifest shows “partial” status after rollback
Symptoms
The rollback completes but rollback_status is partial instead of completed.
Causes
One or more components did not reach completed or skipped status.
Resolution
Check which components are not completed:
cat /opt/omnia/.data/rollback_manifest.yml
Review the component status to identify the failed component.
After fixing the issue, rerun the full rollback. Already-completed components are skipped automatically:
cd /omnia/rollback
ansible-playbook rollback.yml
11.2.3 Manifest file is missing or corrupted
Symptoms
The playbook fails because upgrade_manifest.yml or rollback_manifest.yml cannot be parsed.
Cause
The manifest file was manually deleted, corrupted due to disk errors, or contains invalid YAML syntax.
Resolution
Check the manifest file for syntax errors:
cat /opt/omnia/.data/upgrade_manifest.yml
If corrupted, remove the manifest to start fresh:
rm /opt/omnia/.data/upgrade_manifest.yml
Rerun the playbook. A new manifest will be initialized from
oim_metadata.yml.
Caution
Removing the manifest means all component statuses are reset to pending. Previously completed components will be re-executed.
11.3 Component-Specific Issues
11.3.1 OIM upgrade fails
Symptoms
The oim component fails during upgrade.
Cause
oim_metadata.ymlis missing or incorrectly configuredomnia_corecontainer is not running or inaccessibleDatabase connectivity issues
Resolution
Check the playbook output for the specific error.
Verify
oim_metadata.ymlis populated correctly:
cat /opt/omnia/.data/oim_metadata.yml
Ensure the
omnia_corecontainer is running and accessible:
podman ps | grep omnia_core
After fixing the issue, rerun:
cd /omnia/upgrade
ansible-playbook upgrade.yml
11.3.2 Kubernetes upgrade fails
Symptoms
The k8s component fails during upgrade with status showing failed in the upgrade manifest.
Cause
Cluster nodes are not in Ready state
Pending pods or stuck resources
Network connectivity issues between nodes
Storage mount failures
Resolution
Check the upgrade status file to identify what failed:
cat <mount_point>/upgrade/upgrade_status.yml
The mount point is defined in your
storage_config.ymlfile. Look for the NFS mount entry wherename: "nfs_k8s"and themount_pointfield shows the path.Verify cluster health:
Ensure all nodes are reachable and in a
ReadystateCheck for pending pods or stuck resources
Fix the underlying issue based on the error.
After resolving, rerun:
cd /omnia/upgrade
ansible-playbook upgrade.yml
Completed steps will be skipped automatically
Only failed steps will be retried
If the issue persists after multiple retries, rollback:
cd /omnia/rollback
ansible-playbook rollback.yml
11.3.3 Cloud-init timeout after reboot
Symptoms
First control plane or first worker reboot fails with “Cloud-init did not complete within timeout” error.
Cause
Cloud-init execution takes longer than the configured timeout period due to slow network, large package downloads, or system resource constraints.
Resolution
SSH to the node and check the
/var/log/cloud-init-output.logand wait for the cloud-init execution to complete.Once execution is completed, rerun the upgrade playbook:
cd /omnia/upgrade
ansible-playbook upgrade.yml
11.3.4 Node unreachable during upgrade
Symptoms
Upgrade fails with SSH connection errors or node unreachable messages.
Cause
Node is powered off or has hardware issues
SSH service is not running on the node
Network connectivity issues between OIM and the node
Firewall blocking SSH connections
Resolution
Verify node is powered on and accessible.
Verify SSH service is running on the node.
After restoring connectivity, rerun the upgrade playbook:
cd /omnia/upgrade
ansible-playbook upgrade.yml
11.3.5 Node drain fails due to standalone pods
Symptoms
Kubernetes upgrade fails during drain with error:
cannot delete Pods that declare no controller (use --force to override)Node is cordoned but drain operation fails
Upgrade status shows
drain_failed
Cause
The node has standalone pods not managed by any controller (Deployment, StatefulSet, etc.). These are typically test pods created manually using kubectl run or kubectl create -f pod.yaml.
Resolution
Identify standalone pods on the failed node:
kubectl get pods -A --field-selector spec.nodeName=<node-ip> -o json |
  jq -r '.items[] | select(.metadata.ownerReferences == null) |
  "\(.metadata.namespace)/\(.metadata.name)"'
Delete the standalone pods:
kubectl delete pod <pod-name> -n <namespace>
Warning
Standalone pods will NOT be recreated after deletion.
Re-run the upgrade:
cd /omnia/upgrade
ansible-playbook upgrade.yml
Prevention
Before starting any upgrade, identify and remove all standalone pods:
kubectl get pods -A -o json | jq -r '.items[] |
  select(.metadata.ownerReferences == null) |
  "\(.metadata.namespace)/\(.metadata.name)"'
Always use Deployments, StatefulSets, or Jobs instead of creating standalone pods in production.
11.3.6 Build image fails for aarch64 — missing inventory
Symptoms
The build_image component fails with: “aarch64 functional groups detected in pxe_mapping_file but no hosts found in ‘admin_aarch64’ inventory group” or “The inventory group ‘admin_aarch64’ does not exist or has no hosts.”
Cause
The PXE mapping file contains aarch64 functional groups, but the upgrade was run without an inventory file containing the [admin_aarch64] group.
Resolution
Create an inventory file with the
[admin_aarch64]group containing exactly one ARM admin node:[admin_aarch64] <arm_admin_node_ip>
Re-run the upgrade with the inventory file:
cd /omnia/upgrade
ansible-playbook upgrade.yml -i <inventory_file>
Note
The [admin_aarch64] group must have exactly one host. NFS must be configured on the OIM for aarch64 image building.
11.3.7 Target core container image is missing
Symptoms
omnia.sh --upgrade or omnia.sh --rollback aborts reporting that the required omnia_core image is not available locally.
Cause
The container image for the target version has not been built on the OIM host.
Resolution
Confirm which image tags are available:
podman images | grep omnia_core
If the required image is missing, build it on the OIM host (see Build the Omnia 2.2.0.0 Core Container Image in the Upgrade guide):
git clone -b omnia-container-v2.2.0.0 https://github.com/dell/omnia-artifactory.git
cd omnia-artifactory
./build_images.sh core core_tag=2.2 omnia_branch=v2.2.0.0
Re-run the
omnia.shcommand.
11.3.8 Kubernetes rollback fails
Symptoms
The k8s-telemetry component fails during rollback.
Cause
Control plane is unreachable or nodes are not in Ready state
Backup files are missing or corrupted on NFS
Storage mount failures preventing access to backup directory
Network connectivity issues between OIM and Kubernetes cluster
Resolution
Check the rollback status file to identify what failed.
The status file is located at
<mount_point>/upgrade/rollback_status.yml. The mount point is defined in yourstorage_config.ymlfile. Look for the NFS mount entry wherename: "nfs_k8s"and themount_pointfield shows the path.Verify the control plane is reachable and check node status.
Check for missing backup files:
Verify the backup directory exists on NFS at
<mount_point>/upgrade/backup/.Check for required backup files:
etcd snapshot:
<mount_point>/upgrade/backup/etcd-snapshot-*.dbetcd members:
<mount_point>/upgrade/backup/etcd-members.jsonK8s configs:
<mount_point>/upgrade/backup/configs/<node>/k8s-config.tar.gz
If backups are missing, rollback cannot proceed. The upgrade must have failed before backups were created, or backups were accidentally deleted.
Check etcd restore issues:
If rollback fails during etcd restore stage with “etcd snapshot restore failed” or “/var/lib/etcd/member does not exist”:
SSH to the affected control plane node.
Check if etcd data directory is accessible at
/var/lib/etcd/.Verify etcdutl binary is available in backup directory at
<mount_point>/upgrade/backup/etcdutl.Manually verify etcd snapshot integrity using etcdutl.
If snapshot is corrupted, rollback cannot proceed.
Check for nodes stuck in NotReady state:
If nodes remain in NotReady state after rollback:
Check node status and identify NotReady nodes.
Check kubelet service status and logs on the affected node.
Verify CNI pods are running in the calico-system namespace.
Restart kubelet service on the affected node.
If issue persists, verify network connectivity and CNI configuration.
After resolving the issue, rerun the full rollback. Already-completed stages are skipped automatically.
11.3.9 Slurm or login nodes do not recover after rollback reboot
Symptoms
The rollback summary reports one or more Slurm/login nodes as unreachable, reboot-failed, or sinfo not responding.
Cause
A node did not boot back with the restored 2.1 configuration, or Slurm services did not start after reboot.
Resolution
Review the node status report printed at the end of the Slurm rollback.
For unreachable nodes, verify power and network connectivity.
For
sinfofailures, check the Slurm service on the node and reconfigure:
systemctl restart slurmd
scontrol reconfigure
Re-run the full rollback. Nodes that already rebooted successfully are not rebooted again:
cd /omnia/rollback
ansible-playbook rollback.yml
Note
There is no standalone provision rollback. Cloud-Init and BSS boot configuration is restored within the Slurm and Kubernetes rollbacks. If a node’s boot configuration appears incorrect after rollback, rerun the rollback for the corresponding component (slurm or k8s).
12. Kernel Version Override Issues
12.1 Repository Sync Issues
Symptoms
local_repo.ymlfails to sync the additional kernel repositories.Kernel packages are not available in Pulp after sync.
Cause
Repository URLs in
local_repo_config.ymlare incorrect or unreachableRHEL subscription (EUS) entitlement certificates are expired or invalid
Pulp container cannot access the external repositories due to network or firewall issues
Resolution
Verify repository URLs are correct and accessible from the
omnia_corecontainer:
podman exec -it omnia_core curl -I <repository_url>
For RHEL subscription (EUS) repositories, verify that the entitlement certificates are valid and correctly placed:
ls -la /opt/omnia/rhel_repo_certs/
Validate kernel packages are available in the synced Pulp repository. From within the
omnia_corecontainer, list the repository distributions:
pulp rpm distribution list
Query the Pulp content endpoint to check for kernel packages. Replace
<oim_admin_ip>with the OIM admin IP and<repo_name>with the distribution name from the previous step:
curl -k https://<oim_admin_ip>:2225/pulp/content/opt/omnia/offline_repo/cluster/x86_64/rhel/10.0/rpms/<repo_name>/Packages/k/ | grep kernel
If no kernel packages are found, correct the repository URLs in
local_repo_config.ymland re-runlocal_repo.yml.
12.2 Kernel Image Not Found in S3
Symptoms
provision.ymlfails with a kernel validation error.The specified
kernel_version_overrideis not found in S3.
Cause
The kernel image was not built or uploaded to S3 during the build image step
The kernel version specified in
provision_config.ymldoes not match any available kernel images in S3The build image playbook (
build_image_x86_64.ymlorbuild_image_aarch64.yml) was not executed or failed
Resolution
Verify that the build image step completed successfully and uploaded images to S3:
s3cmd ls -Hr s3://boot-images
Look for kernel and initramfs entries matching your functional group:
s3://boot-images/efi-images/<functional_group>/rhel-<functional_group>_omnia_<version>/vmlinuz-<kernel_version>
s3://boot-images/efi-images/<functional_group>/rhel-<functional_group>_omnia_<version>/initramfs-<kernel_version>.img
If the expected kernel is missing, verify that the kernel packages were available in the Pulp repository before running
build_image_x86_64.yml. The build process selects the latest kernel available across all configured repositories.Re-run the build image playbook to rebuild with the correct kernel:
cd /omnia/build_image_x86_64
ansible-playbook build_image_x86_64.yml
After the build completes, verify the new kernel image in S3 using
s3cmd ls -Hr s3://boot-imagesand then re-runprovision.yml.
12.3 PXE Boot Issues
Symptoms
Nodes fail to PXE boot after kernel override.
Nodes boot with the old kernel version instead of the overridden version.
Cause
BSS boot parameters were not updated with the new kernel version
The kernel version specified in
provision_config.ymldoes not match the kernel images available in S3Network connectivity issues between nodes and the OIM prevent fetching the correct boot parameters
DHCP or TFTP services are not running correctly
Resolution
Validate the following:
BSS configuration matches the expected kernel and initrd paths in S3
Network connectivity between nodes and the OIM
DHCP and TFTP services are running
Node console logs for boot errors
Verify the booted kernel version on the node:
uname -r
If the kernel version does not match the expected override, check that kernel_version_override in provision_config.yml is set correctly and re-run provision.yml.
12.4 EUS Subscription Certificate Issues
Symptoms
local_repo.ymlfails with TLS/SSL errors when syncing EUS repositories.Pulp reports authentication failures for RHEL CDN URLs.
Cause
RHEL subscription (EUS) entitlement certificates have expired or are invalid
Certificate files are missing or not accessible from the configured paths in
local_repo_config.ymlSSL/TLS certificate trust issues between the Pulp container and RHEL CDN
Resolution
Verify the certificate files exist at the configured paths:
ls -la /opt/omnia/rhel_repo_certs/
Ensure the CA certificate, client key, and client certificate are valid and not expired:
openssl x509 -in /opt/omnia/rhel_repo_certs/<entitlement-cert>.pem -noout -dates
Verify the
sslcacert,sslclientkey, andsslclientcertpaths inlocal_repo_config.ymlmatch the actual file locations on the OIM.After correcting the certificates, re-run
local_repo.yml.
13. OpenCHAMI Upgrade/Rollback Issues
13.1 Upgrade or Rollback Fails at the Cloud-Init/BSS Verification Gate
Symptoms
upgrade/upgrade.ymlorrollback/rollback.ymlfails during therenew_certificates.ymlstep with the error:Certificate recovery gate FAILED. Services still unreachable after acme-deploy restart.ochami bss service statusorochami cloud-init service statusreturnsconnection refusedor a non-zero exit codeCritical OpenCHAMI services (for example,
haproxy,coresmd,cloud-init-server) are inactive or in a failed state after certificate renewal
Cause
OpenCHAMI services have not fully stabilized following the certificate update and container restart
HAProxy is using a stale backend or DNS cache, or an outdated TLS certificate
The
coresmdservice (v2.1) or thecoresmd-coredhcp/coresmd-corednsservices (v2.2) did not restart after HAProxy
Resolution
Perform the following commands on the OIM node to verify and recover the services:
Identify services that are not running:
systemctl list-dependencies openchami.target --plain | while read svc; do
  echo "$svc: $(systemctl is-active $svc)"
done
Verify BSS and cloud-init service status:
ochami bss service status
ochami cloud-init service status
Reset failed services and restart the OpenCHAMI target:
systemctl reset-failed
systemctl restart openchami.target
sleep 30
If cloud-init or BSS remains unreachable, refresh HAProxy and the certificate:
systemctl restart acme-deploy.service
sleep 10
systemctl stop haproxy.service
systemctl start haproxy.service
sleep 10
Verify that all OpenCHAMI services are operational:
systemctl list-dependencies openchami.target
Re-run the upgrade or rollback playbook:
# For upgrade
cd /omnia/upgrade
ansible-playbook upgrade.yml

# For rollback
cd /omnia/rollback
ansible-playbook rollback.yml
13.2 Cloud-Init/BSS Updates Fail During Upgrade or Rollback
Symptoms
The OpenCHAMI
update_cloud_init_bssstep (executed as part ofupgrade/upgrade.ymlorrollback/rollback.yml) fails with the error:OpenCHAMI services are unreachable after certificate renewal and HAProxy restart.ochami cloud-init service statusorochami bss service statusfails before the BSS or cloud-init updates are applied
Cause
OpenCHAMI services are not yet reachable when the step begins
HAProxy or
cloud-init-serverhas not completed startup following the certificate renewal or container restart
Resolution
Verify OpenCHAMI service health on the OIM:
ochami cloud-init service status
ochami bss service status
systemctl status haproxy.service
podman logs cloud-init-server
Recover the services using the procedure in :ref:`Section 13.1 <openchami-upgrade-rollback-gate>`.
Re-run the failed playbook:
# For upgrade
cd /omnia/upgrade
ansible-playbook upgrade.yml

# For rollback
cd /omnia/rollback
ansible-playbook rollback.yml
14. General Troubleshooting Steps
Increase Ansible verbosity for detailed output:
cd /omnia/upgrade
ansible-playbook upgrade.yml -vvv
All state files are stored in /opt/omnia/.data/:
ls -la /opt/omnia/.data/
cat /opt/omnia/.data/upgrade_manifest.yml
cat /opt/omnia/.data/rollback_manifest.yml
cat /opt/omnia/.data/oim_metadata.yml
Previous manifests are archived for history:
ls /opt/omnia/.data/archive/
To completely reset the upgrade/rollback state and start fresh:
Caution
This will discard all upgrade/rollback progress. Use only as a last resort.
rm -f /opt/omnia/.data/upgrade_manifest.yml
rm -f /opt/omnia/.data/rollback_manifest.yml
rm -f /opt/omnia/.data/upgrade_in_progress.lock
rm -f /opt/omnia/.data/rollback_in_progress.lock
The oim_metadata.yml file is the source of truth for version information. Ensure it contains:
cat /opt/omnia/.data/oim_metadata.yml
Expected fields:
omnia_version— Currently installed versionprevious_omnia_version— Previous versionupgrade_backup_dir— Path to the backup directory
Note
oim_metadata.yml is read-only for upgrade and rollback flows. It is never modified by the playbooks. If the version information is incorrect, it must be fixed manually before rerunning.
If you have any feedback about Omnia documentation, please reach out at omnia.readme@dell.com.