Verify iDRAC Telemetry Flow
This section outlines the steps to verify iDRAC telemetry data flow from Kafka to VictoriaMetrics and VictoriaLogs.
Verify iDRAC Telemetry Messages in Kafka
To verify that iDRAC telemetry data is being successfully published to the idrac Kafka topic, do the following:
Log in to the Service Kubernetes Control plane.
Set the required variables using the following command:
KAFKA_LB_IP=<external IP of bridge-bridge-lb service>
TOPIC=idrac
GROUP=idrac-consumer-group
INSTANCE=idrac-consumer-1
Create a Kafka consumer using the following command:
KAFKA_LB_IP=<external load balancer IP of the bridge-bridge-lb service>
curl -X POST http://$KAFKA_LB_IP:8080/consumers/idrac-consumer-group \
-H 'content-type: application/vnd.kafka.v2+json' \
-d '{
        "name": "idrac-consumer-1",
        "format": "json",
        "auto.offset.reset": "earliest"
    }'
To view the list of iDRAC Kafka topics configured, use the following command:
curl -s -X GET "http://$KAFKA_LB_IP:8080/topics" | jq '.'
Subscribe the consumer to the telemetry topic using the following command:
curl -X POST http://$KAFKA_LB_IP:8080/consumers/idrac-consumer-group/instances/idrac-consumer-1/subscription \
-H 'content-type: application/vnd.kafka.v2+json' \
-d '{"topics": ["idrac"]}'
Consume messages from the topic using the following command:
while true; do curl -X GET http://$KAFKA_LB_IP:8080/consumers/idrac-consumer-group/instances/idrac-consumer-1/records \
-H 'accept: application/vnd.kafka.json.v2+json' | jq '.' ;  sleep 2; done
If telemetry metrics are collected correctly, the output contains JSON-formatted iDRAC telemetry records.
Verify VictoriaMetrics TLS Connectivity
To verify TLS connectivity for VictoriaMetrics, run the VictoriaMetrics TLS test job to verify that certificates and secure connectivity are functioning correctly:
cd /<nfs client mount path of the service k8s cluster>/telemetry/deployments/test
kubectl apply -f victoria-tls-test-job.yaml
After the job completes, check the logs to confirm that the TLS connection is successful:
kubectl logs victoria-tls-test-xxx -n telemetry
Verify Kafka TLS Connectivity
To verify TLS connectivity for Kafka, run the Kafka TLS test job to verify that certificates, truststores, keystores, and mTLS communication are functioning correctly:
cd /<nfs client mount path of the service k8s cluster>/telemetry/deployments/test
kubectl apply -f kafka.tls_test_job.yaml
After the job completes, check the logs to confirm that the TLS connection is successful:
kubectl logs kafka-tls-test-xxx -n telemetry
View Collected iDRAC Telemetry Data using VictoriaMetrics UI (VMUI) - Cluster Mode Deployment
After applying the telemetry.yml configuration using the VictoriaMetrics deployment mode as cluster,
use the (VMUI) to validate that iDRAC telemetry data is being collected and stored
successfully in a cluster mode VictoriaMetrics deployment. For more details, see
VictoriaMetrics Cluster deployment documentation.
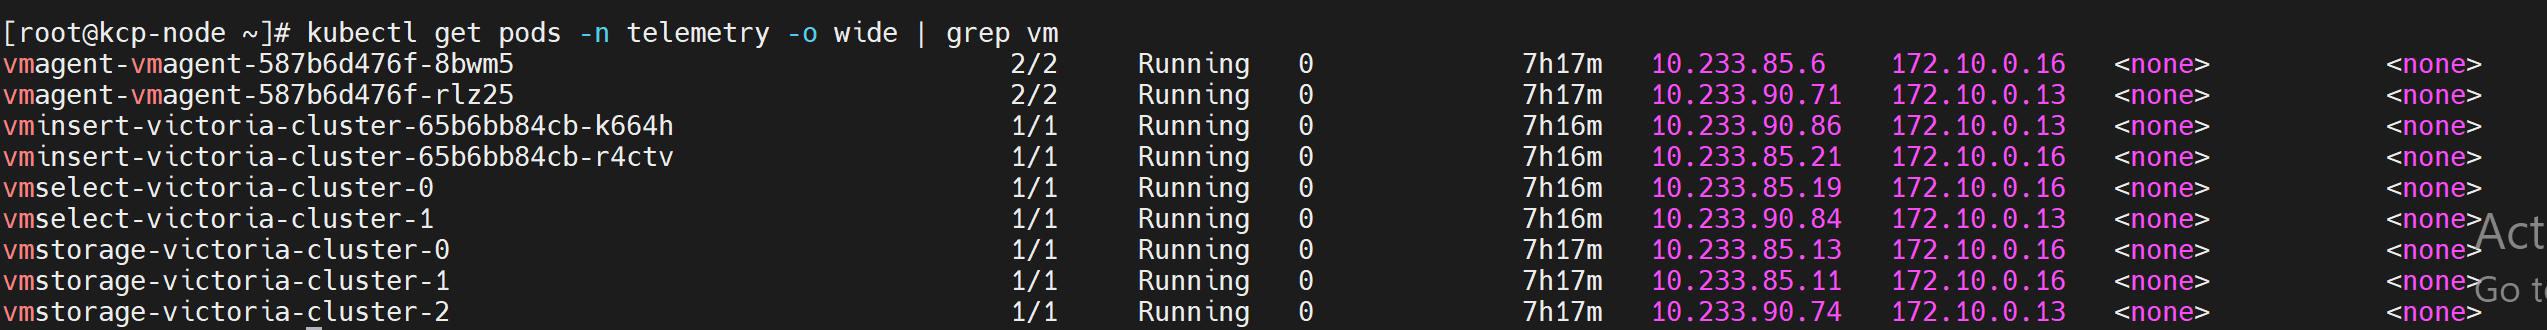
Run the following command to verify that the VictoriaMetrics pod is running:
kubectl get pods -n telemetry -o wide | grep vm
Run the following command to verify that the VictoriaMetrics service is running:
kubectl get service -n telemetry | grep vm

Note the External IP and port number of the VictoriaMetrics service. The external IP and port number will be used to access the VictoriaMetrics UI (VMUI).
Access the VMUI in a web browser using:
https://<external vmselect loadbalancer IP>:8481/select/0/vmui
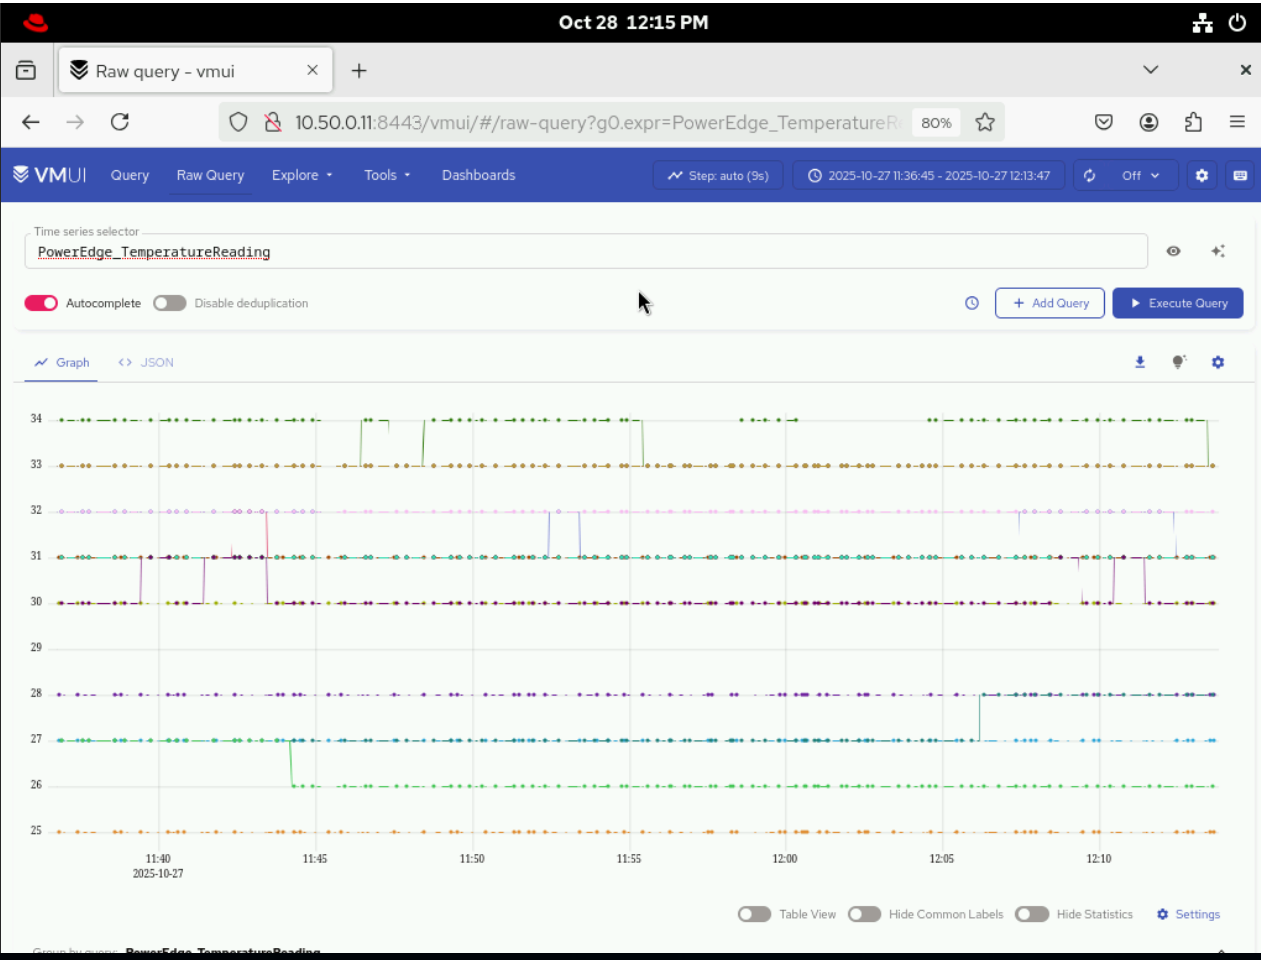
5. Filter and view telemetry metrics using queries in VMUI. For example, the following “PowerEdge_TemperatureReading” query displays all available metrics:
If you have any feedback about Omnia documentation, please reach out at omnia.readme@dell.com.