Verify UFM Telemetry Flow
This section outlines the steps to verify UFM telemetry data in VictoriaMetrics.
View Collected UFM Telemetry Data using VictoriaMetrics UI (VMUI) - Cluster Mode Deployment
After applying the telemetry.yml configuration using the VictoriaMetrics deployment mode as cluster,
use the (VMUI) to validate that UFM telemetry data is being collected and stored
successfully in a cluster mode VictoriaMetrics deployment. For more details, see
VictoriaMetrics Cluster deployment documentation.
Run the following command to verify that the VictoriaMetrics pod is running:
kubectl get pods -n telemetry -o wide | grep vm

Run the following command to verify that the VictoriaMetrics service is running:
kubectl get service -n telemetry -o wide | grep vm

Run the following command to verify VMagent logs for UFM scraping to view recent logs:
VMAGENT_POD=$(kubectl get pods -n telemetry -l app.kubernetes.io/name=vmagent -o jsonpath='{.items[0].metadata.name}')
kubectl logs $VMAGENT_POD -n telemetry -c vmagent --tail=50

Note the External IP and port number of the VictoriaMetrics service. The external IP and port number will be used to access the VictoriaMetrics UI (VMUI):
kubectl get svc -n telemetry | grep vmselect

Access the VMUI in a web browser using:
``https://<external vmselect loadbalancer IP>:8481/select/vmui``
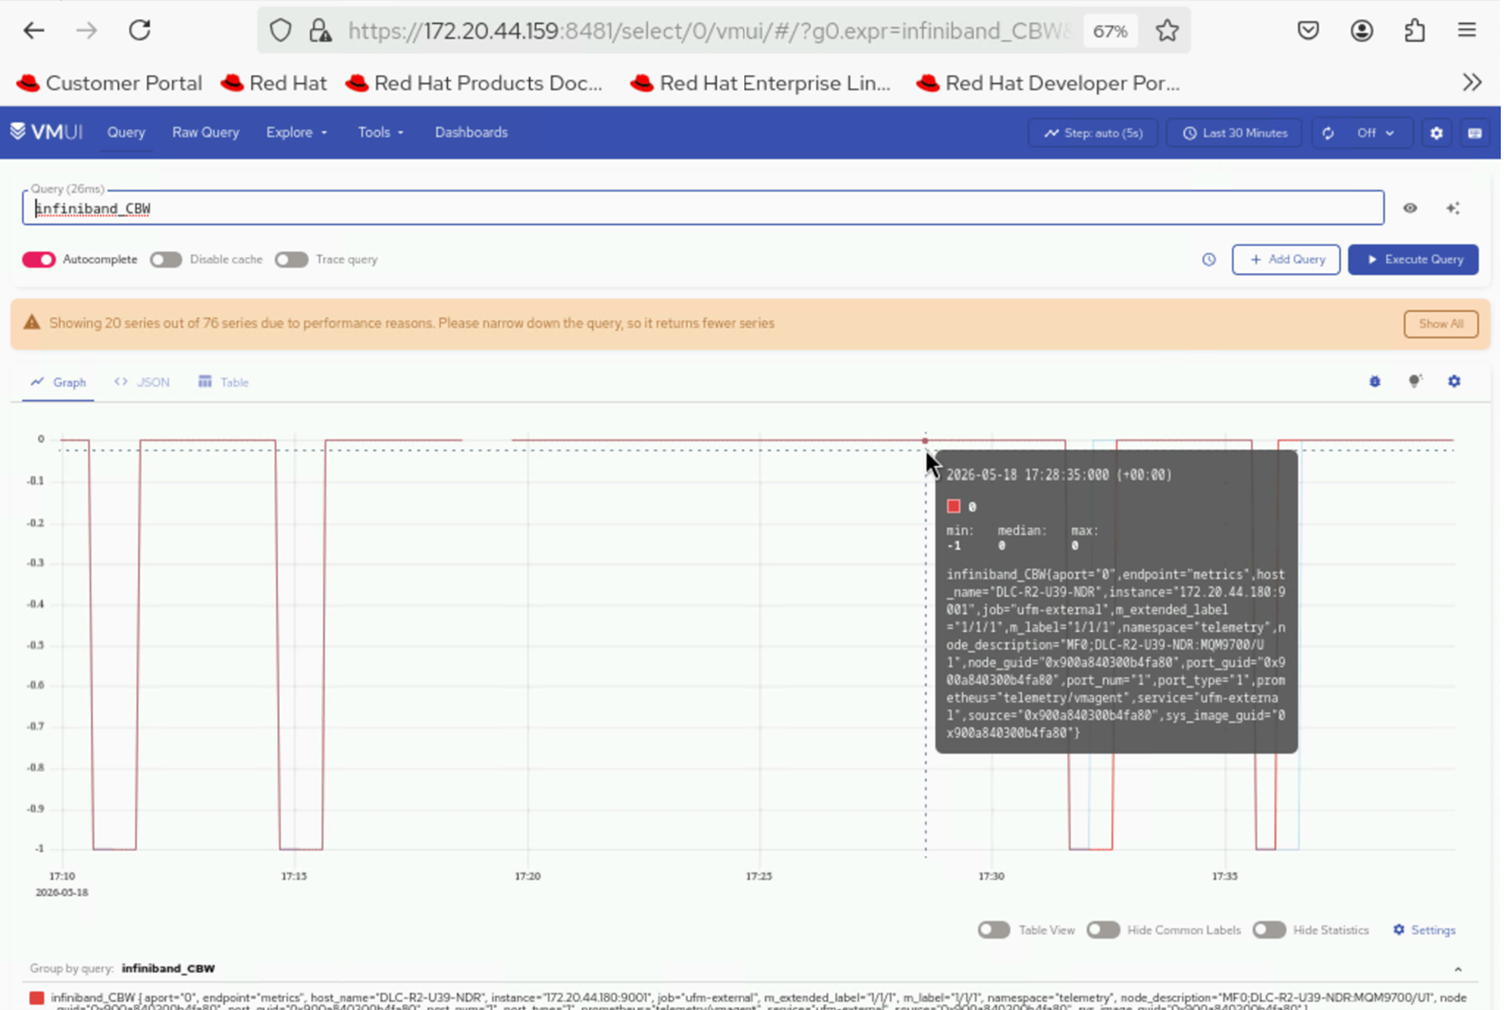
6. Filter and view UFM InfiniBand metrics using queries in VMUI. For example, the following query displays UFM InfiniBand metrics:
{source="ufm", subsystem="infiniband"}
Key UFM Metrics
Metric Name |
Description |
Unit |
|---|---|---|
Metric Name |
Description |
Unit |
ib_port_state |
InfiniBand port operational state (1=down, 2=init, 3=armed, 4=active) |
state |
ib_port_xmit_data |
Transmitted data per port |
bytes |
ib_port_rcv_data |
Received data per port |
bytes |
ib_port_xmit_pkts |
Transmitted packets per port |
packets |
ib_port_rcv_pkts |
Received packets per port |
packets |
ib_port_symbol_error |
Symbol error count per port |
count |
ib_port_link_error_recovery |
Link error recovery count per port |
count |
ib_port_link_downed |
Link downed count per port |
count |
ib_port_rcv_errors |
Received errors per port |
count |
ib_port_vl15_dropped |
VL15 dropped packets per port |
packets |
ib_excessive_buffer_overrun_errors |
Excessive buffer overrun error count per port |
count |
View UFM Logs using VictoriaLogs
Configure the VLAgent LoadBalancer IP address for syslog delivery. Retrieve the VLAgent LoadBalancer IP and configure it on the UFM appliance by following the steps outlined in the prerequisites section above:
kubectl get svc -n telemetry | grep -E "(vlagent|victoria-logs)"

Retrieve the external IP and port of the vlselect service:
kubectl get svc -n telemetry | grep vlselect

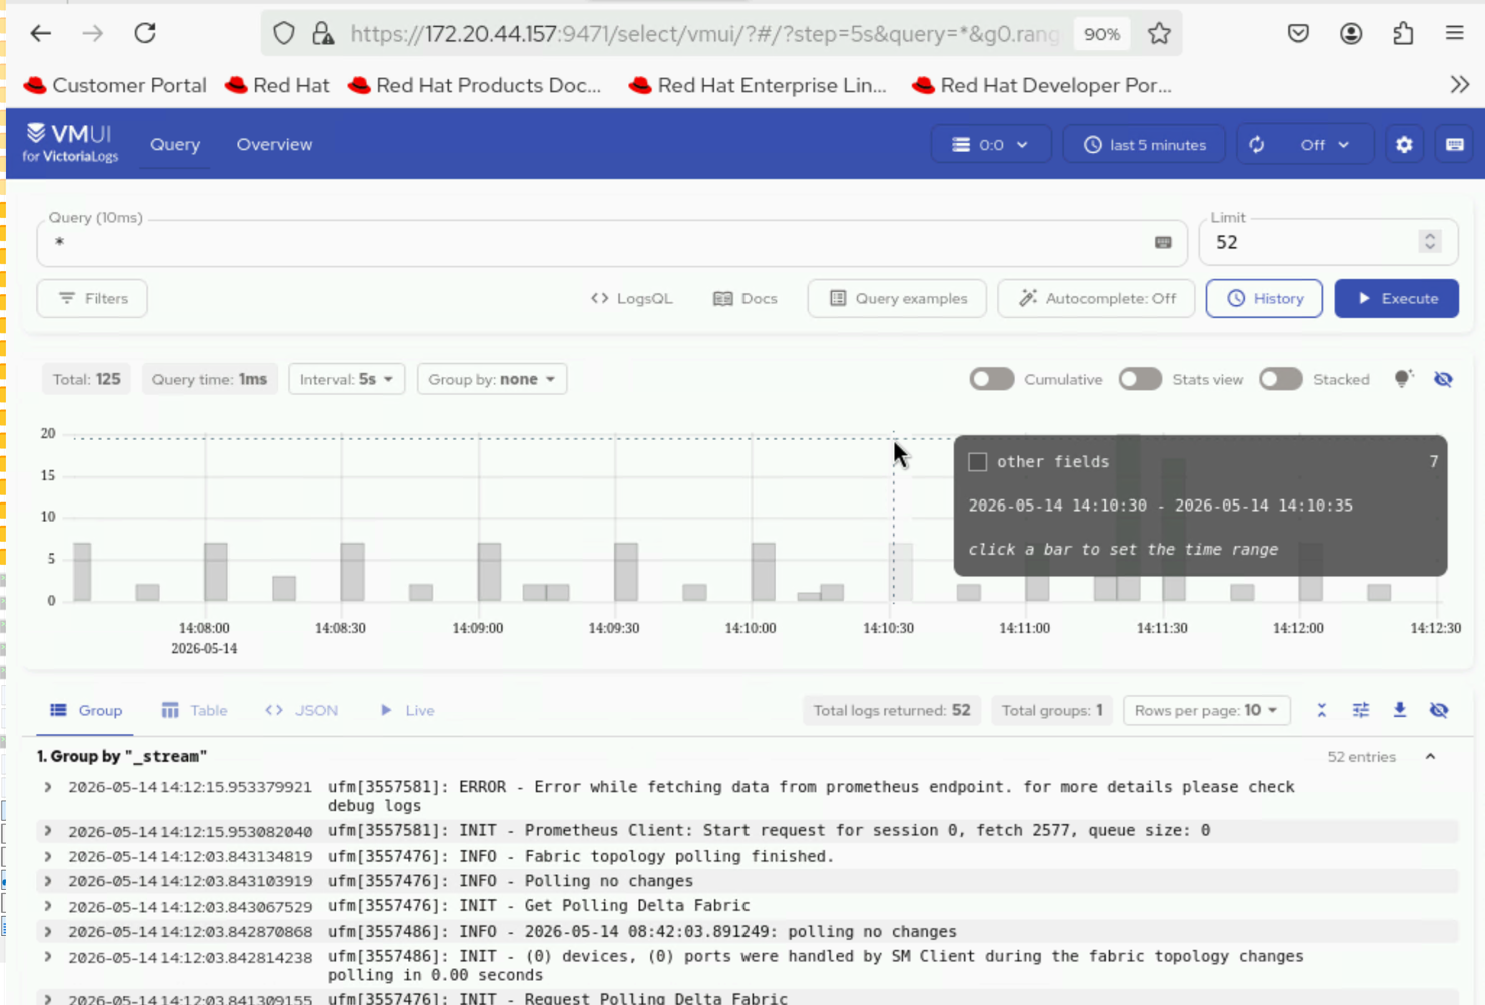
Access the VMUI in a web browser using:
``https://<external vlselect loadbalancer IP>:9471/select/0/vmui``
If you have any feedback about Omnia documentation, please reach out at omnia.readme@dell.com.