Step 8: Configure Telemetry Requirements
Omnia supports the following telemetry collection to monitor and manage your HPC infrastructure.
Core Telemetry
iDRAC Telemetry collects out-of-band system metrics from Dell servers, including power, thermal, and hardware health information. The iDRAC Telemetry data can be collected and sent to Kafka and VictoriaMetrics.
LDMS Telemetry collects in-band performance metrics such as CPU, memory, network, and I/O statistics from compute nodes. The LDMS Telemetry data can be collected and sent to Kafka. To route LDMS telemetry to VictoriaMetrics, enable the Vector Telemetry Pipeline.
PowerScale Telemetry collects the PowerScale Telemetry data and logs and sends them to VictoriaMetrics and VictoriaLogs.
DCGM Telemetry collects NVIDIA GPU metrics including temperature, utilization, memory, ECC errors, and power from compute nodes. The DCGM Telemetry data can be collected and sent to Kafka and VictoriaMetrics.
UFM Telemetry collects NVIDIA UFM InfiniBand Fabric Manager metrics and syslog logs, including IB port state, transmit/receive data, error counters, and fabric topology. The UFM Telemetry data and logs can be collected and sent to VictoriaMetrics and VictoriaLogs, respectively.
VAST Telemetry collects storage performance metrics and syslog events from VAST Storage appliances. The VAST Telemetry data can be collected and sent to VictoriaMetrics, while the logs can be collected and sent to VictoriaLogs.
Vector Telemetry Pipeline
The Vector Telemetry Pipeline provides Kafka-to-Victoria ingestion using Vector for collecting, transforming, and routing telemetry data to VictoriaMetrics and VictoriaLogs:
Vector-LDMS routes LDMS metrics from Kafka to VictoriaMetrics
Vector-OpenManage Enterprise routes OpenManage Enterprise metrics and logs from Kafka to VictoriaMetrics and VictoriaLogs
External Integrations
OpenManage Enterprise Telemetry collects metrics and logs from OpenManage Enterprise and sends them to Kafka. To route OpenManage Enterprise telemetry to VictoriaMetrics and VictoriaLogs, enable the Vector Telemetry Pipeline. For integration steps, see ExternalTelemetry/external_kafka_ome.
SFM Telemetry collects network telemetry metrics from Smart Fabric Manager and sends them to VictoriaMetrics. For integration steps, see ExternalTelemetry/external_victoria_sfm.
Note
To enable any telemetry and log collections (iDRAC, LDMS, PowerScale, DCGM, UFM, Vast, or Vector), ensure that the service_k8s entry is mentioned in the software_config.json file and the corresponding telemetry source fields are set to true in the telemetry_config.yml file. For example, set telemetry_sources > idrac > metrics_enabled = true to enable iDRAC telemetry, or telemetry_sources > powerscale > metrics_enabled = true to enable PowerScale telemetry.
Omnia Telemetry Architecture
Omnia collects telemetry data from HPC cluster nodes using: LDMS for OS-level metrics and iDRAC for hardware telemetry.
The following diagram illustrates the telemetry services that can be deployed using Omnia and the data flow between the components.
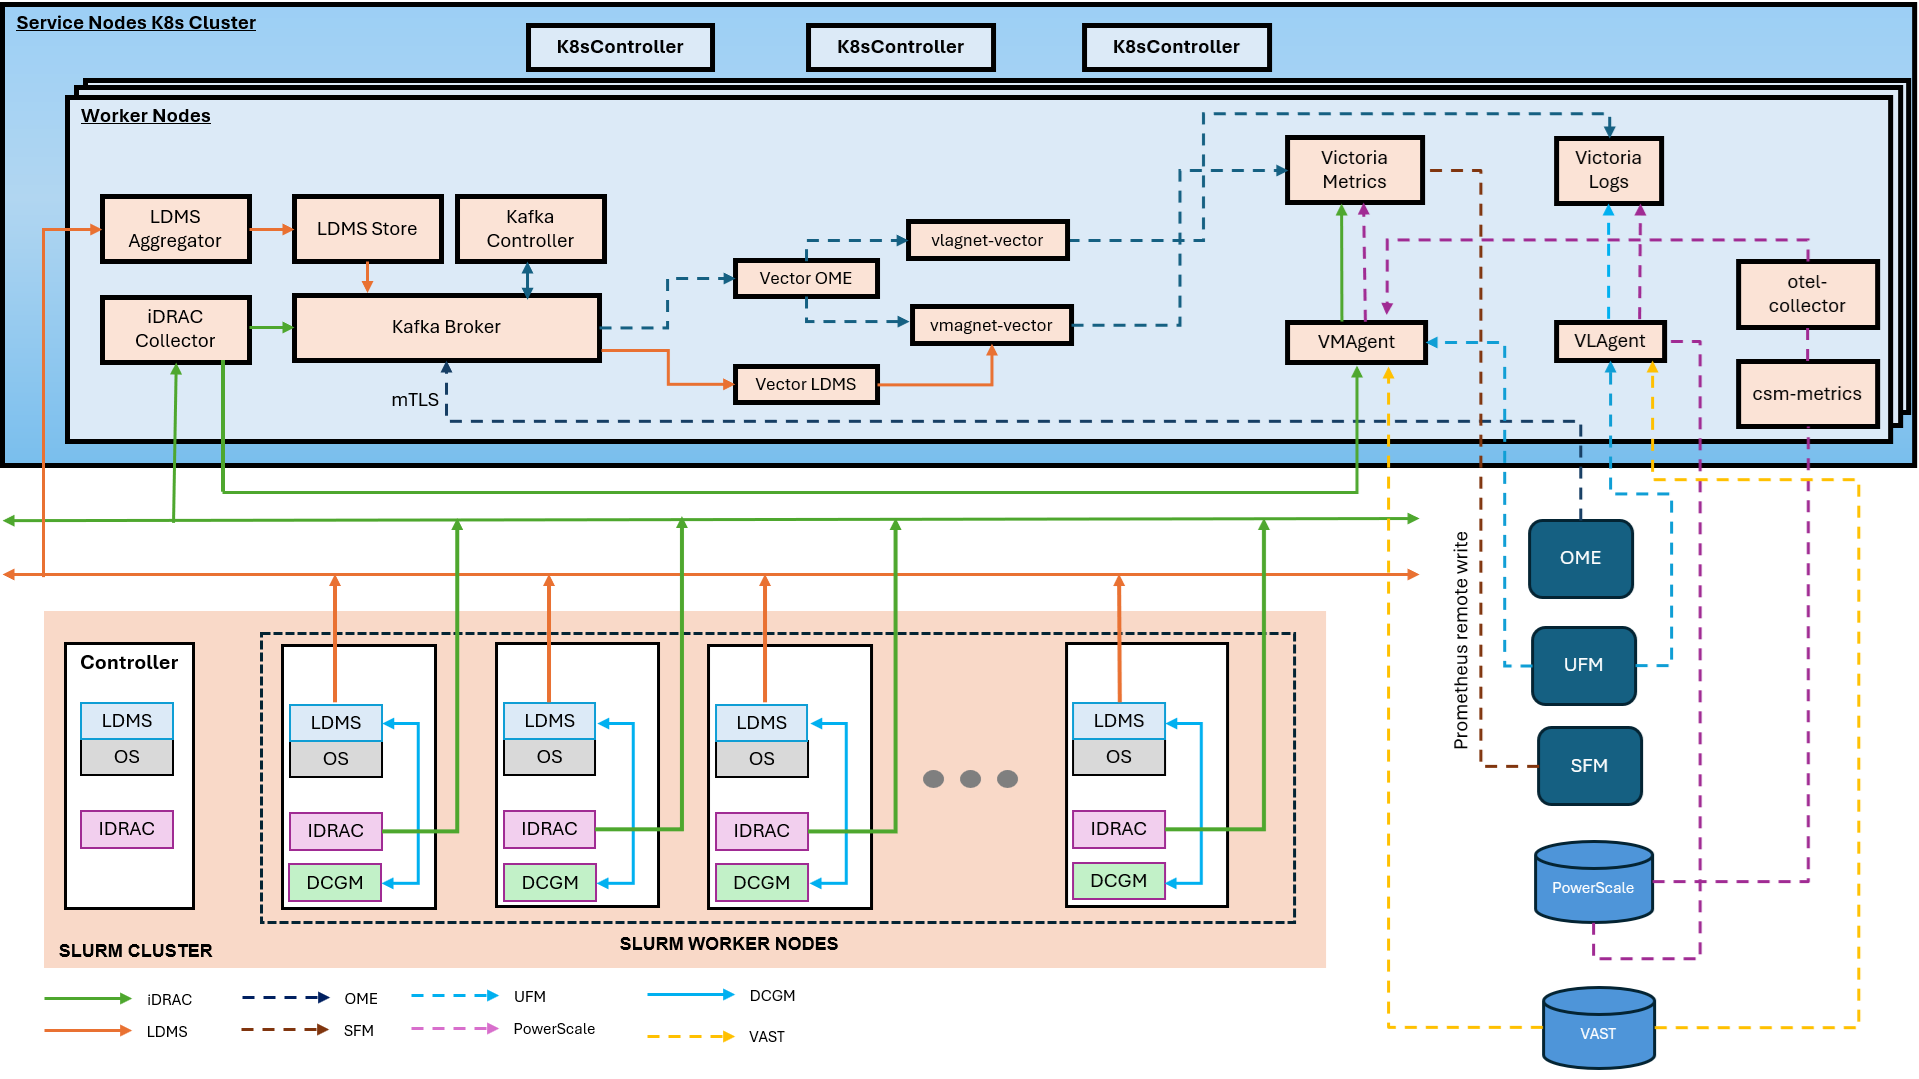
Telemetry Components
The following components are involved in the telmetry services deployed by Omnia:
OIM (Omnia Infrastructure Manager)
Central management node that deploys and configures all telemetry services across the cluster.
Service Kubernetes Cluster
Hosts telemetry collection and storage services:
LDMS Aggregator – Receives metrics from slurm compute node samplers.
LDMS Store – Stores aggregated LDMS data
iDRAC Collector – Collects hardware telemetry via Redfish API
Kafka Broker – Streams telemetry data
VMAgent – Forwards metrics to Victoria Metrics
Victoria Metrics – Time-series database for metric storage
vmstorage-victoria-cluster – Storage backend for VictoriaMetrics cluster
vminsert-victoria-cluster – Ingestion component for VictoriaMetrics cluster
vmselect-victoria-cluster – Query component for VictoriaMetrics cluster
VictoriaLogs Cluster – Distributed log storage system with vlstorage, vlinsert, vlselect components
vlstorage-victoria-logs-cluster – Storage backend for VictoriaLogs cluster
vlinsert-victoria-logs-cluster – Ingestion component for VictoriaLogs cluster
vlselect-victoria-logs-cluster – Query component for VictoriaLogs cluster
VLAgent – Platform-managed log collection agent that receives logs from external sources
karavi-metrics-powerscale – Collects PowerScale metrics via Karavi Observability
csm-metrics – Collects PowerScale metrics
csi-volume-exporter – Exports CSI volume metrics
otel-collector – Forwards metrics to Victoria Metrics and Victoria Logs
CSI Driver for Dell PowerScale: – Driver required for communication between PowerScale and service Kubernetes nodes
Vector – High-performance data pipeline tool for collecting, transforming, and routing logs and metrics
Vector-LDMS – Kafka consumer for LDMS metrics, routes to VictoriaMetrics via vmagent-vector
Vector-OME – Kafka consumer for OME telemetry, routes metrics to VictoriaMetrics and logs to VictoriaLogs
vmagent-vector – Dedicated vmagent instance as a write-buffer between Vector pods and vminsert
vlagent-vector – Dedicated VictoriaLogs forwarding agent for log/event data from Vector pods
Slurm Cluster
Each slurm compute node runs:
LDMS Sampler – Collects OS metrics (CPU, memory, network, and I/O)
iDRAC – Provides hardware health data (temperature, power, and fans)
iDRAC and LDMS Telemetry Data Flows
LDMS Flow (OS Metrics)
Slurm Compute Nodes (LDMS Sampler) → LDMS Aggregator → LDMS Store → Kafka
iDRAC Flow (Hardware Metrics)
iDRAC (BMC) → iDRAC Collector → Kafka
iDRAC (BMC) → iDRAC Collector → VMAgent → Victoria Metrics
UFM Telemetry Data Flows
UFM Fabric Manager → OTEL Collector → vmagent(shared) → victoria_metric
UFM Fabric Manager forwards syslog → vlagent → Victoria Logs
VAST Telemetry Data Flows
VAST Storage Appliances → OTEL Collector → vmagent(shared) → victoria_metric
VAST Storage Appliances forwards syslog → vlagent → Victoria Logs
DCGM Telemetry Data Flows
GPU Nodes → DCGM → VMAgent → Victoria Metrics
Vector Telemetry Data Flows
LDMS Store (store_avro_kafka) → Kafka 'ldms' topic → Vector-LDMS → vmagent-vector → vminsert → VictoriaMetrics
OME → Kafka '*.inventory', '*.telemetry', '*.health', '*.alerts', '*.auditlogs' topics → Vector-OME → vmagent-vector (metrics) → vminsert → VictoriaMetrics
OME → Kafka '*.inventory', '*.telemetry', '*.health', '*.alerts', '*.auditlogs' topics → Vector-OME → vlagent-vector (logs) → vlinsert → VictoriaLogs
Note
To list all Kafka topics (including LDMS, iDRAC, and OME topics), run the following command:
curl -s -X GET "http://$KAFKA_LB_IP:8080/topics" | jq '.'
PowerScale Telemetry Data Flows
PowerScale Nodes → CSM Metrics PowerScale → OTEL Collector → vmagent(shared) → victoria_metric
PowerScale Nodes forwards syslog →  vlagent → Victoria Logs
Telemetry Configuration Topics
If you have any feedback about Omnia documentation, please reach out at omnia.readme@dell.com.