Configure OpenManage Enterprise Integration with Omnia Kafka Pipeline for Secure Telemetry Data Streaming
This section describes how to configure OpenManage Enterprise to securely stream metrics into the Service Kubernetes clusters using mutual TLS (mTLS).
Note
To consume OpenManage Enterprise telemetry from Kafka topics and route to VictoriaMetrics and VictoriaLogs using Vector, see Configure Vector Telemetry Pipeline to Route Data to Victoria from Kafka.
Prerequisites
Ensure that the
pod_external_ip_rangeparameter is set in theomnia_config.ymlfile for the Service Kubernetes cluster and it is reachable from the OpenManage Enterprise appliance network.Ensure Kafka is installed and running in the Service Kubernetes cluster.
External access to Kafka is available through the following LoadBalancer ports:
9094for ingesting and querying data.
Ensure that the nodes are discovered in OpenManage Enterprise before configuring telemetry streaming.
Ensure that OpenManage Enterprise Advanced License is installed on the OME discovered nodes. This license is required to retrieve OME telemetry.
Configuration Steps
Run the following playbook to retrieve the Kafka connection details and TLS certificates from the Service Kubernetes cluster:
cd /omnia/utils
ansible-playbook external_kafka_connect_details.yml
- The
external_kafka_connect_details.ymlplaybook performs the following: Retrieves the Kafka LoadBalancer external IP.
Extracts the server CA certificate and client certificates/keys from the telemetry namespace.
Writes the Kafka endpoint and TLS file locations to
/opt/omnia/telemetry/external_kafka_connect_details.yml.Saves the TLS files in
/opt/omnia/telemetry/external_kafka/:ca.crt(server certificate)user.crt(client certificate)user.key(client key)
Note
If OpenManage Enterprise is installed on a different system than the OIM host, copy
ca.crtto that system before uploading it in the UI.- The
Create a client certificate in
.pfxformat for mTLS by running the following command. Provide a passphrase when prompted:cd /opt/omnia/telemetry/external_kafka/ openssl pkcs12 -export -out user.pfx -inkey user.key -in user.crt

In OpenManage Enterprise, navigate to Configuration > Remote Connectivity, and select Enable.
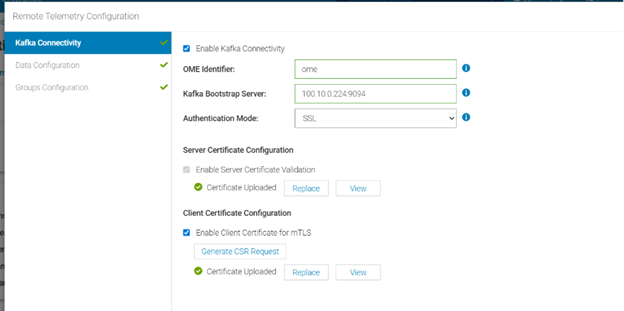
In the Kafka Connectivity wizard, select the Enable Kafka Connectivity check box to turn on Kafka integration.
In the OME Identifier field, enter a unique identifier to be used as the topic prefix for publishing OpenManage Enterprise metrics.
In the Kafka Bootstrap Server field, enter the Kafka external endpoint displayed by the playbook, along with the port number.
Example:
<Kafka LoadBalancer External IP>:<Port Number>
From the Authentication Mode list, select SSL.
Under Server Certificate Validation, select the Enable Server Certificate Validation check box, and upload
ca.crtfrom/opt/omnia/telemetry/external_kafka/.Under Client Certificate Configuration, select the Enable Client Certificate for mTLS check box, and upload the client certificate (
user.pfx) generated in Step 2. Enter the password or passphrase used to generate the certificate, and click Next.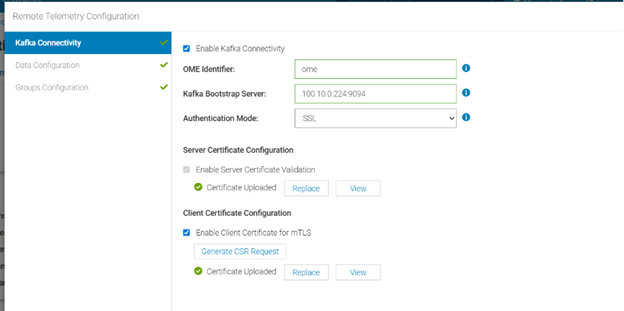
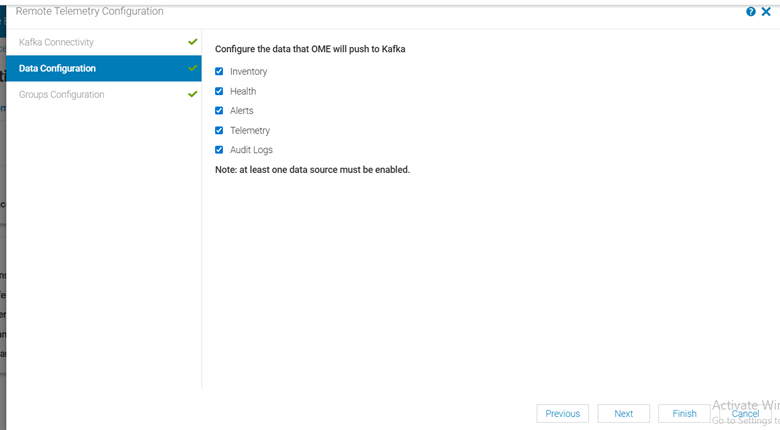
On the Data Configuration page, select the metrics to stream to the Omnia Kubernetes Service cluster, and click Next.
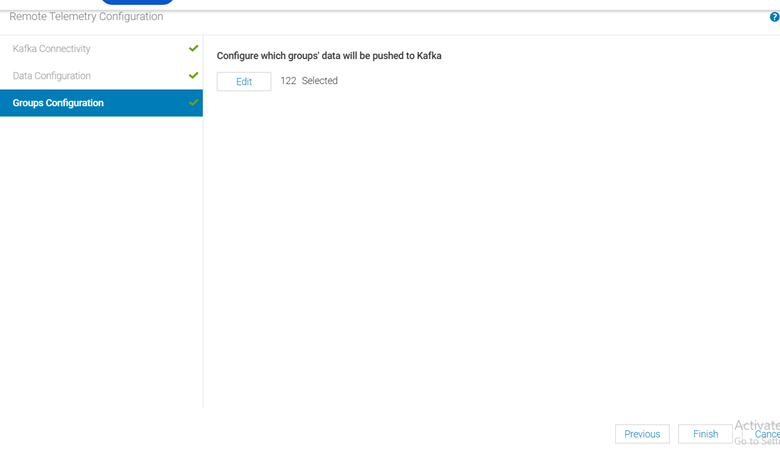
On the Group Configuration page, select the devices and device groups from which metrics should be collected, and click Next.
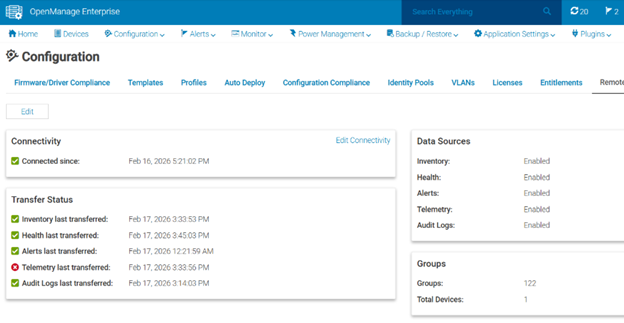
Navigate to Configuration > Remote Connectivity and verify the following:
Under Connectivity, a green check mark next to Connected since indicates successful connectivity between OpenManage Enterprise and the Omnia Service Kubernetes cluster.
Under Transfer status, green check marks next to each metric indicate that the selected metrics are being successfully transmitted without errors.
If you have any feedback about Omnia documentation, please reach out at omnia.readme@dell.com.