Troubleshooting guide
PXE Boot Hangs During Node Replacement
When an existing node is replaced with a new node and discovery.yml is rerun, the new node may hang during PXE boot at nm-wait-online-initrd.service.
Cause: An IP address conflict occurs when the new node is assigned an IP address that is still in use by the old node on the network.
Resolution: Before adding the new node, complete the following steps:
Ensure the old node is powered off or disconnected from the network.
Verify that the IP address is not in use by any other device.
Rerun
discovery.ymlafter confirming that no IP conflicts exist.
Checking and updating encrypted parameters
Move to the file path where the parameters are saved (as an example, we will be using
omnia_config_credentials.yml):cd /opt/omnia/input/project_default/
To view the encrypted parameters:
ansible-vault view omnia_config_credentials.yml --vault-password-file .omnia_config_credentials_key
To edit the encrypted parameters:
ansible-vault edit omnia_config_credentials.yml --vault-password-file .omnia_config_credentials_key
Checking podman container status from the OIM
Use this command to get a list of all running podman conatiners:
podman psCheck the status of any specific podman containers:
podman ps -f name=<container_name>
Packages download issues during local_repo.yml playbook execution
The
local_repo.ymlplaybook generates and provides log files as part of its execution. For example, if the local repository is partially unsuccessful for nfs, analyze the issue using the following steps:
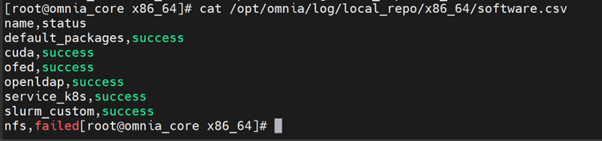
To view the overall download status of all software in the .csv format, run the following command:
opt/omnia/log/local_repo/<arch>/software.csv
Example:
/opt/omnia/log/local_repo/x86_64/software.csv
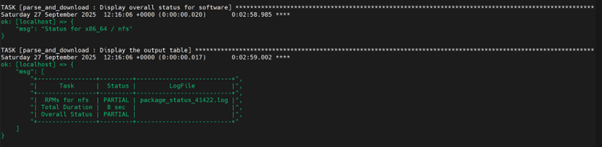
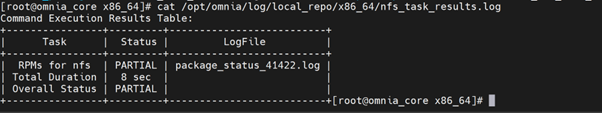
To view the overall download status of all packages and the log filenames for a specific software, run the following command:
/opt/omnia/log/local_repo/<sw>_task_results.log
Example: For nfs:
/opt/omnia/log/local_repo/x86_64/nfs_task_results.log
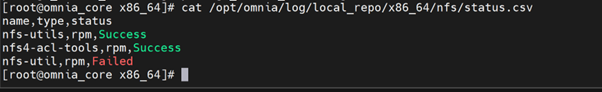
To view the package level status, run the following command:
/opt/omnia/log/local_repo/x86_64/<sw>/status.csv
Example:
/opt/omnia/log/local_repo/x86_64/nfs/status.csv
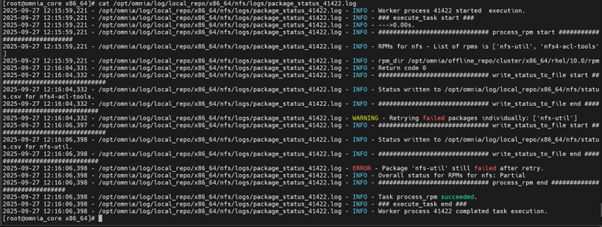
To view the issues information and the reason for job being unsuccessful, see the
package_status_<pid>.logfile mentioned in the<sw>_task_result.log.
Example:
/opt/omnia/log/local_repo/x86_64/nfs/logs/package_status_41422.log
Troubleshooting logs
For more information, see Logs.
Troubleshooting PowerScale isilon pods after node reboot
Why is the PowerScale (Isilon) CSI controller pod in CrashLoopBackOff after a node reboot, and how can it be resolved?
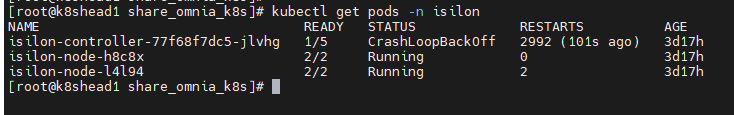
Resolution: Do the following:
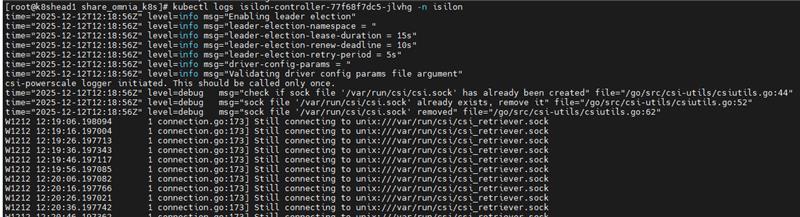
Inspect recent logs from the controller deployment:
kubectl logs deploy/isilon-controller -n isilon --all-containers=true | tail -n 60
Restart the Isilon controller deployment:
kubectl rollout restart deployment isilon-controller -n isilon
Restart the Isilon node daemonset:
kubectl rollout restart daemonset isilon-node -n isilon
These actions ensure that any components affected by the reboot are recreated properly and resume normal operation.
Troubleshooting LDMS on the slurm nodes
Check the ldms aggregator and ldms store logs.
kubectl logs -n telemetry nersc-ldms-aggr-0
kubectl logs -n telemetry nersc-ldms-store-slurm-cluster-0
SSH to the slurm node from where the LDMS metrics are not retrieved.
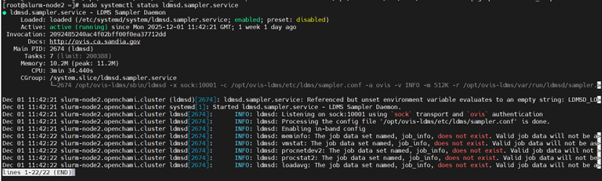
Run
sudo systemctl status ldmsd.sampler.serviceand check ldmsd service is running on the slurm nodes.
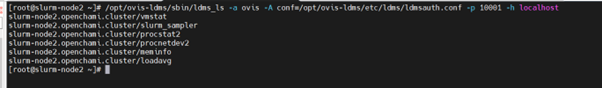
If the ldmsd daemon is running, check whether supported plugins are loaded using the following command:
/opt/ovis-ldms/sbin/ldms_ls -a ovis -A conf=/opt/ovis-ldms/etc/ldms/ldmsauth.conf -p 10001 -h localhost
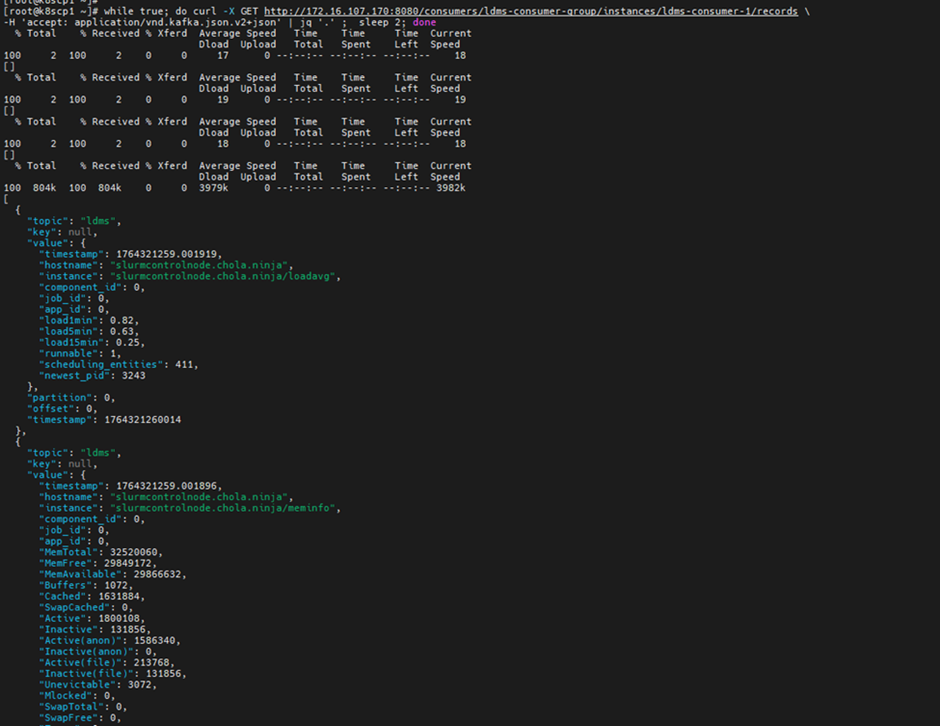
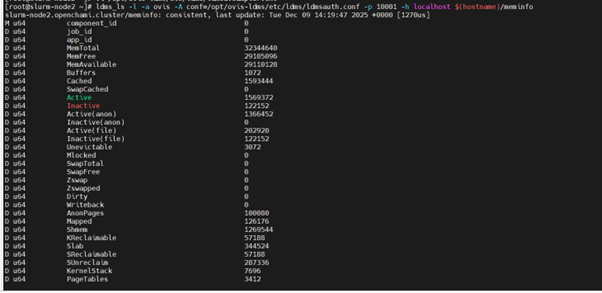
If ldms plugins are loaded, check the metrics of each plugin using the following command:
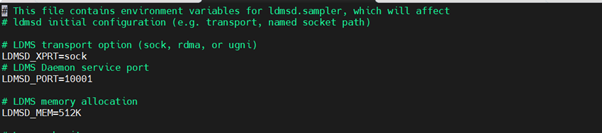
Get the ldsm_port from the file /opt/ovis-ldms/etc/ldms/ldmsd.sampler.env and run the following command:
ldms_ls -l -a ovis -A conf=/opt/ovis-ldms/etc/ldms/ldmsauth.conf -p <ldms_port> -h localhost $(hostname)/<plugin_name>
Example:
ldms_ls -l -a ovis -A conf=/opt/ovis-ldms/etc/ldms/ldmsauth.conf -p 10001 -h localhost $(hostname)/meminfo
Pulp Repository Sync and Publication Failures
No Space Left on NFS Share (where Pulp is mounted).
Observation: Pulp storage runs out of disk space during sync or publish. In this case , Pulp logs show the error “No space left on device.” Check the available storage space on the NFS share.
Resolution: Increase the size of the NFS share where Pulp is mounted to free up space.
Incorrect URL in
local_repo_config.yml.
Observation: The repository URLs in the local_repo_config.yml file may be incorrect . The URL must point to the repository root (where the repodata directory exists) and be reachable.
Resolution: Verify and update the URLs in the local_repo_config.yml file to ensure they are correct and accessible.
NFS storage configuration or performance
Observation: If Pulp is mounted on NFS, network delays can impact performance, potentially causing sync or publication issues.
Resolution: Reduce PULP_SYNC_CONCURRENCY and PULP_PUBLISH_CONCURRENCY to 1 in config.py.
Location:
vi  common/library/module_utils/local_repo/config.py
PULP_SYNC_CONCURRENCY =  1
PULP_PUBLISH_CONCURRENCY = 1
Re-run Failed Operations: After making the changes, re-run the Ansible playbook to retry the failed operations:
ansible-playbook local_repo.yml.
After job submission on the Slurm cluster, compute nodes intermittently enter the DRAINED state
When Slurm nodes go into a DRAINED state after job submission, one possible cause is a failure in an epilog script under /etc/slurm/epilog.d due to incorrect file permissions.
To resolve, ensure the epilog script is executable on all Slurm nodes.
For example:
chmod 0755 /etc/slurm/epilog.d/logout_user.sh
After updating the permissions, reload the Slurm configuration:
scontrol reconfigure
If you have any feedback about Omnia documentation, please reach out at omnia.readme@dell.com.