Integrate Smart Fabric Manager (SFM) with VictoriaMetrics for Secure Telemetry Data Streaming
This section describes how to configure Smart Fabric Manager to securely stream telemetry metrics to the Service Kubernetes cluster.
This procedure assumes that VictoriaMetrics is deployed in cluster mode in the
telemetry namespace of the Service Kubernetes cluster.
For more information, see the VictoriaMetrics cluster mode documentation.
Prerequisites
Make sure the following prerequisites are met:
Ensure that the Secure Shell (SSH) is enabled on the Smart Fabric Manager (SFM) virtual machine. For detailed steps on how to enable SSH, see the Smart Fabric Manager documentation.
Ensure that the
pod_external_ip_rangeparameter is set in theomnia_config.ymlfile for the Service Kubernetes cluster and it is reachable from the SFM network.Ensure VictoriaMetrics (Cluster Mode) is installed and running in the Service Kubernetes cluster.
External access to VictoriaMetrics is available through the following LoadBalancer ports:
8480for ingesting data8481for querying data
Steps
Run the following playbook to retrieve the VictoriaMetrics connection details and TLS certificate from the Service Kubernetes cluster:
cd /omnia/utils
ansible-playbook external_victoria_connect_details.yml
- The
external_victoria_connect_details.ymlplaybook performs the following: Retrieves the VictoriaMetrics vminsert and vmselect LoadBalancer IPs.
Extracts the server CA certificate for TLS.
Writes the connection details to
/opt/omnia/telemetry/external_victoria_connect_details.yml.Saves the CA certificate at
/opt/omnia/telemetry/victoria-certs/ca.crt.
- The
In the Smart Fabric Manager for SONiC UI, navigate to Observability, and then select the Settings tab.
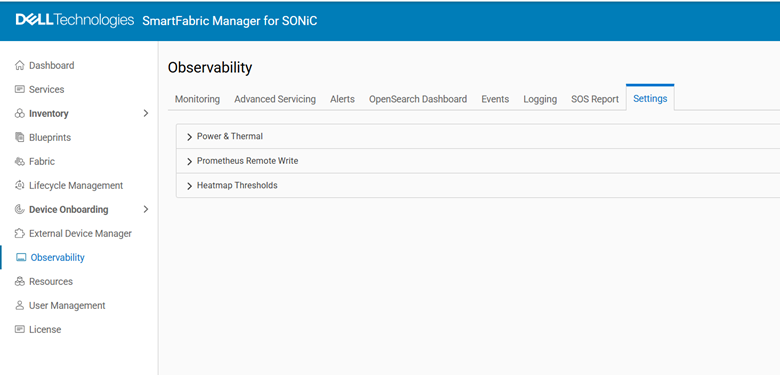
Under Prometheus Remote Write, select the option button next to
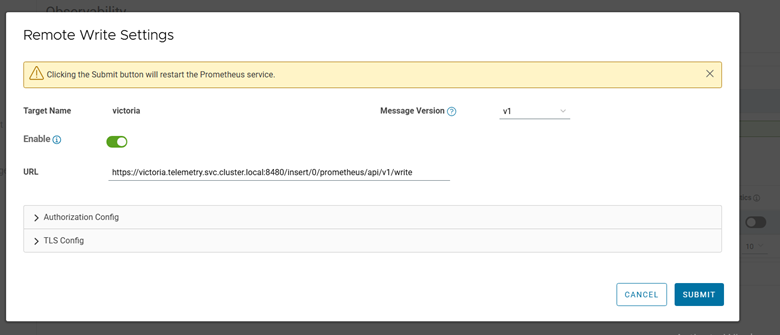
vminsert-target, and then select Edit.- Configure the following settings:
Enable: ON
URL:
https://vminsert.telemetry.svc.cluster.local:8480/insert/0/prometheus/api/v1/writeMessage Version: v1
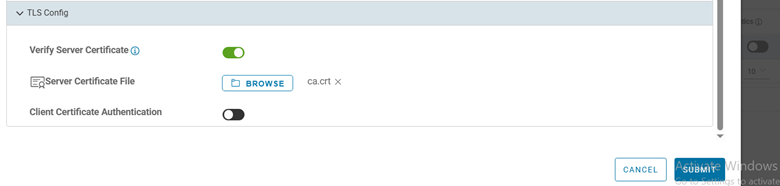
TLS Config: Upload
ca.crtfrom/opt/omnia/telemetry/victoria-certs/as the Server Certificate File
Note
If SFM is installed on a different system than the OIM host, copy
ca.crtto that system before uploading it in the UI.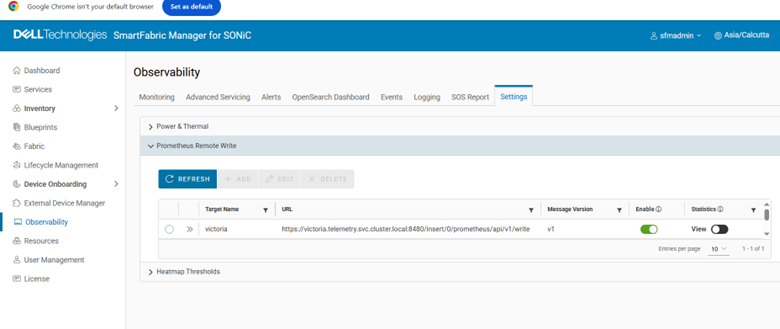
Update the
etc/hostsfile of the Kubernetes Prometheus pod in the SFM VM by performing the following steps:Log in to the SFM VM.
Run the following command to connect to the SFM VM using SSH with your admin credentials:
ssh <admin_user>@<sfm_vm_ip>
From the SFM - Main Menu, enter 6 to select Debug Menu.
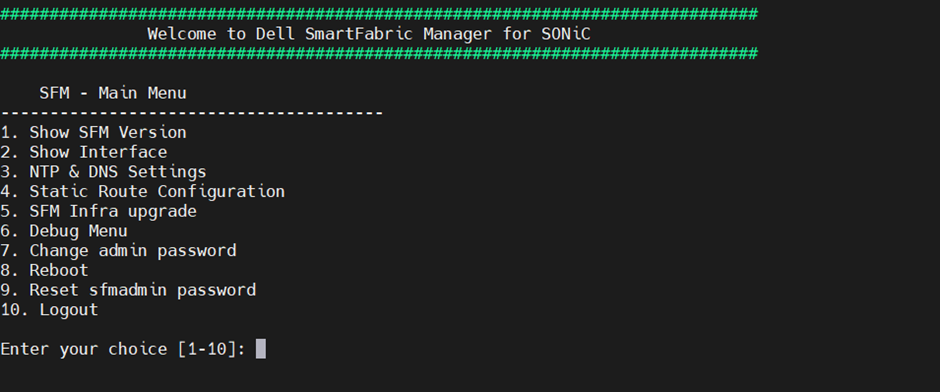
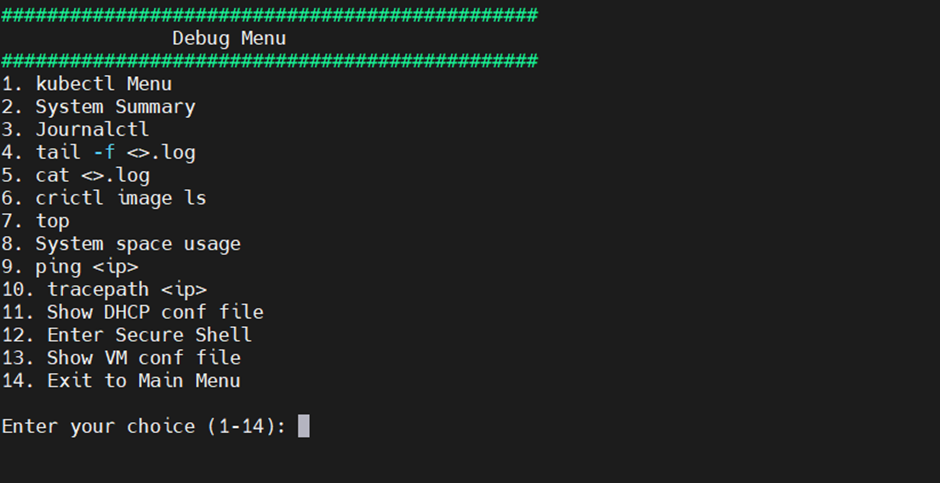
From the Debug Menu, enter 12 to select Enter Secure Shell. This will open a shell session on the SFM host VM.
Identify the Prometheus pod using the following command:
kubectl get pods -A | grep prometheus

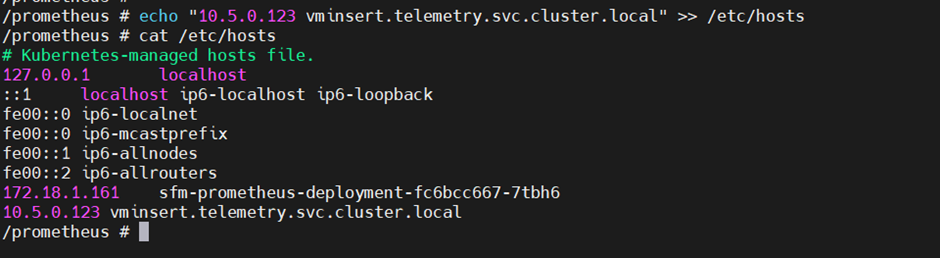
Inside the Prometheus pod, add the VictoriaMetrics insert LoadBalancer IP to
/etc/hostskubectl exec -it -n <Prometheus Namespace> <Prometheus Pod Name> -- /bin/sh echo "<vmselect loadbalancer ip> vminsert.telemetry.svc.cluster.local" >> /etc/hosts

View Collected SFM Telemetry Data using VictoriaMetrics UI (VMUI) - Cluster Mode Deployment
To view the SFM telemetry data that is streamed to VictoriaMetrics, do the following:
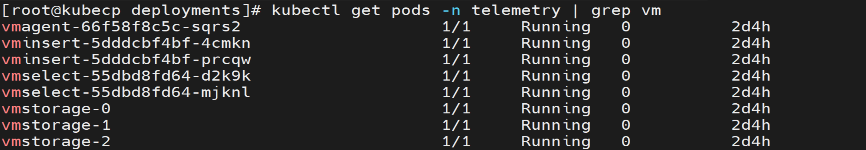
Run the following command to verify that the VictoriaMetrics pod is running:
kubectl get pods -n telemetry -o wide | grep vm
Run the following command to verify that that all the services of VictoriaMetrics cluster are running:
kubectl get service -n telemetry -o wide | grep vm

Note the External IP and port number of the
vmselectservice. The external IP and port number will be used to access the VictoriaMetrics UI (VMUI).Access the VMUI in a web browser using:
https://<external vmselect loadbalancer IP>:8481/select/0/vmui
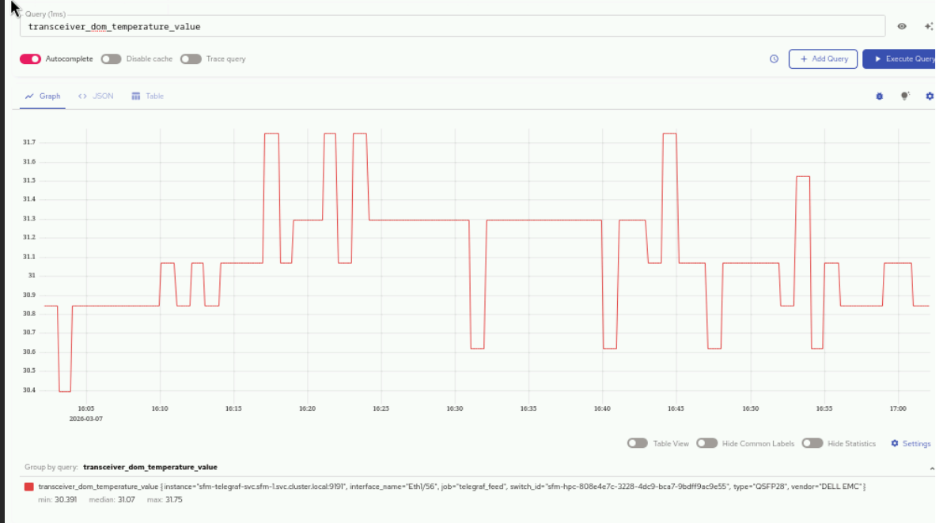
5. Filter and view telemetry metrics using queries in VMUI. For example, the following query displays transceiver DOM temperature values:
transceiver_dom_temperature_value
The following are some of the key metrics that can be queried:
transceiver_dom_temperature_value- Monitors optical transceiver temperature for hardware health
queue_tx_pkts- Tracks transmitted packets per queue for performance monitoring
queue_drop_pkts- Counts dropped packets per queue to identify congestion issues
queue_tx_bits_per_second- Measures queue throughput in bits per second
ifcounters_in_octets- Monitors incoming data volume in bytes per interface
ifcounters_out_octets- Monitors outgoing data volume in bytes per interface
ifcounters_in_pkts- Counts incoming packets per interface
ifcounters_out_pkts- Counts outgoing packets per interface
ifcounters_in_errors- Tracks input errors per interface for fault detection
ifcounters_out_errors- Tracks output errors per interface for fault detection
If you have any feedback about Omnia documentation, please reach out at omnia.readme@dell.com.